Cluster
Cluster level dashboards
Cluster Level Monitoring
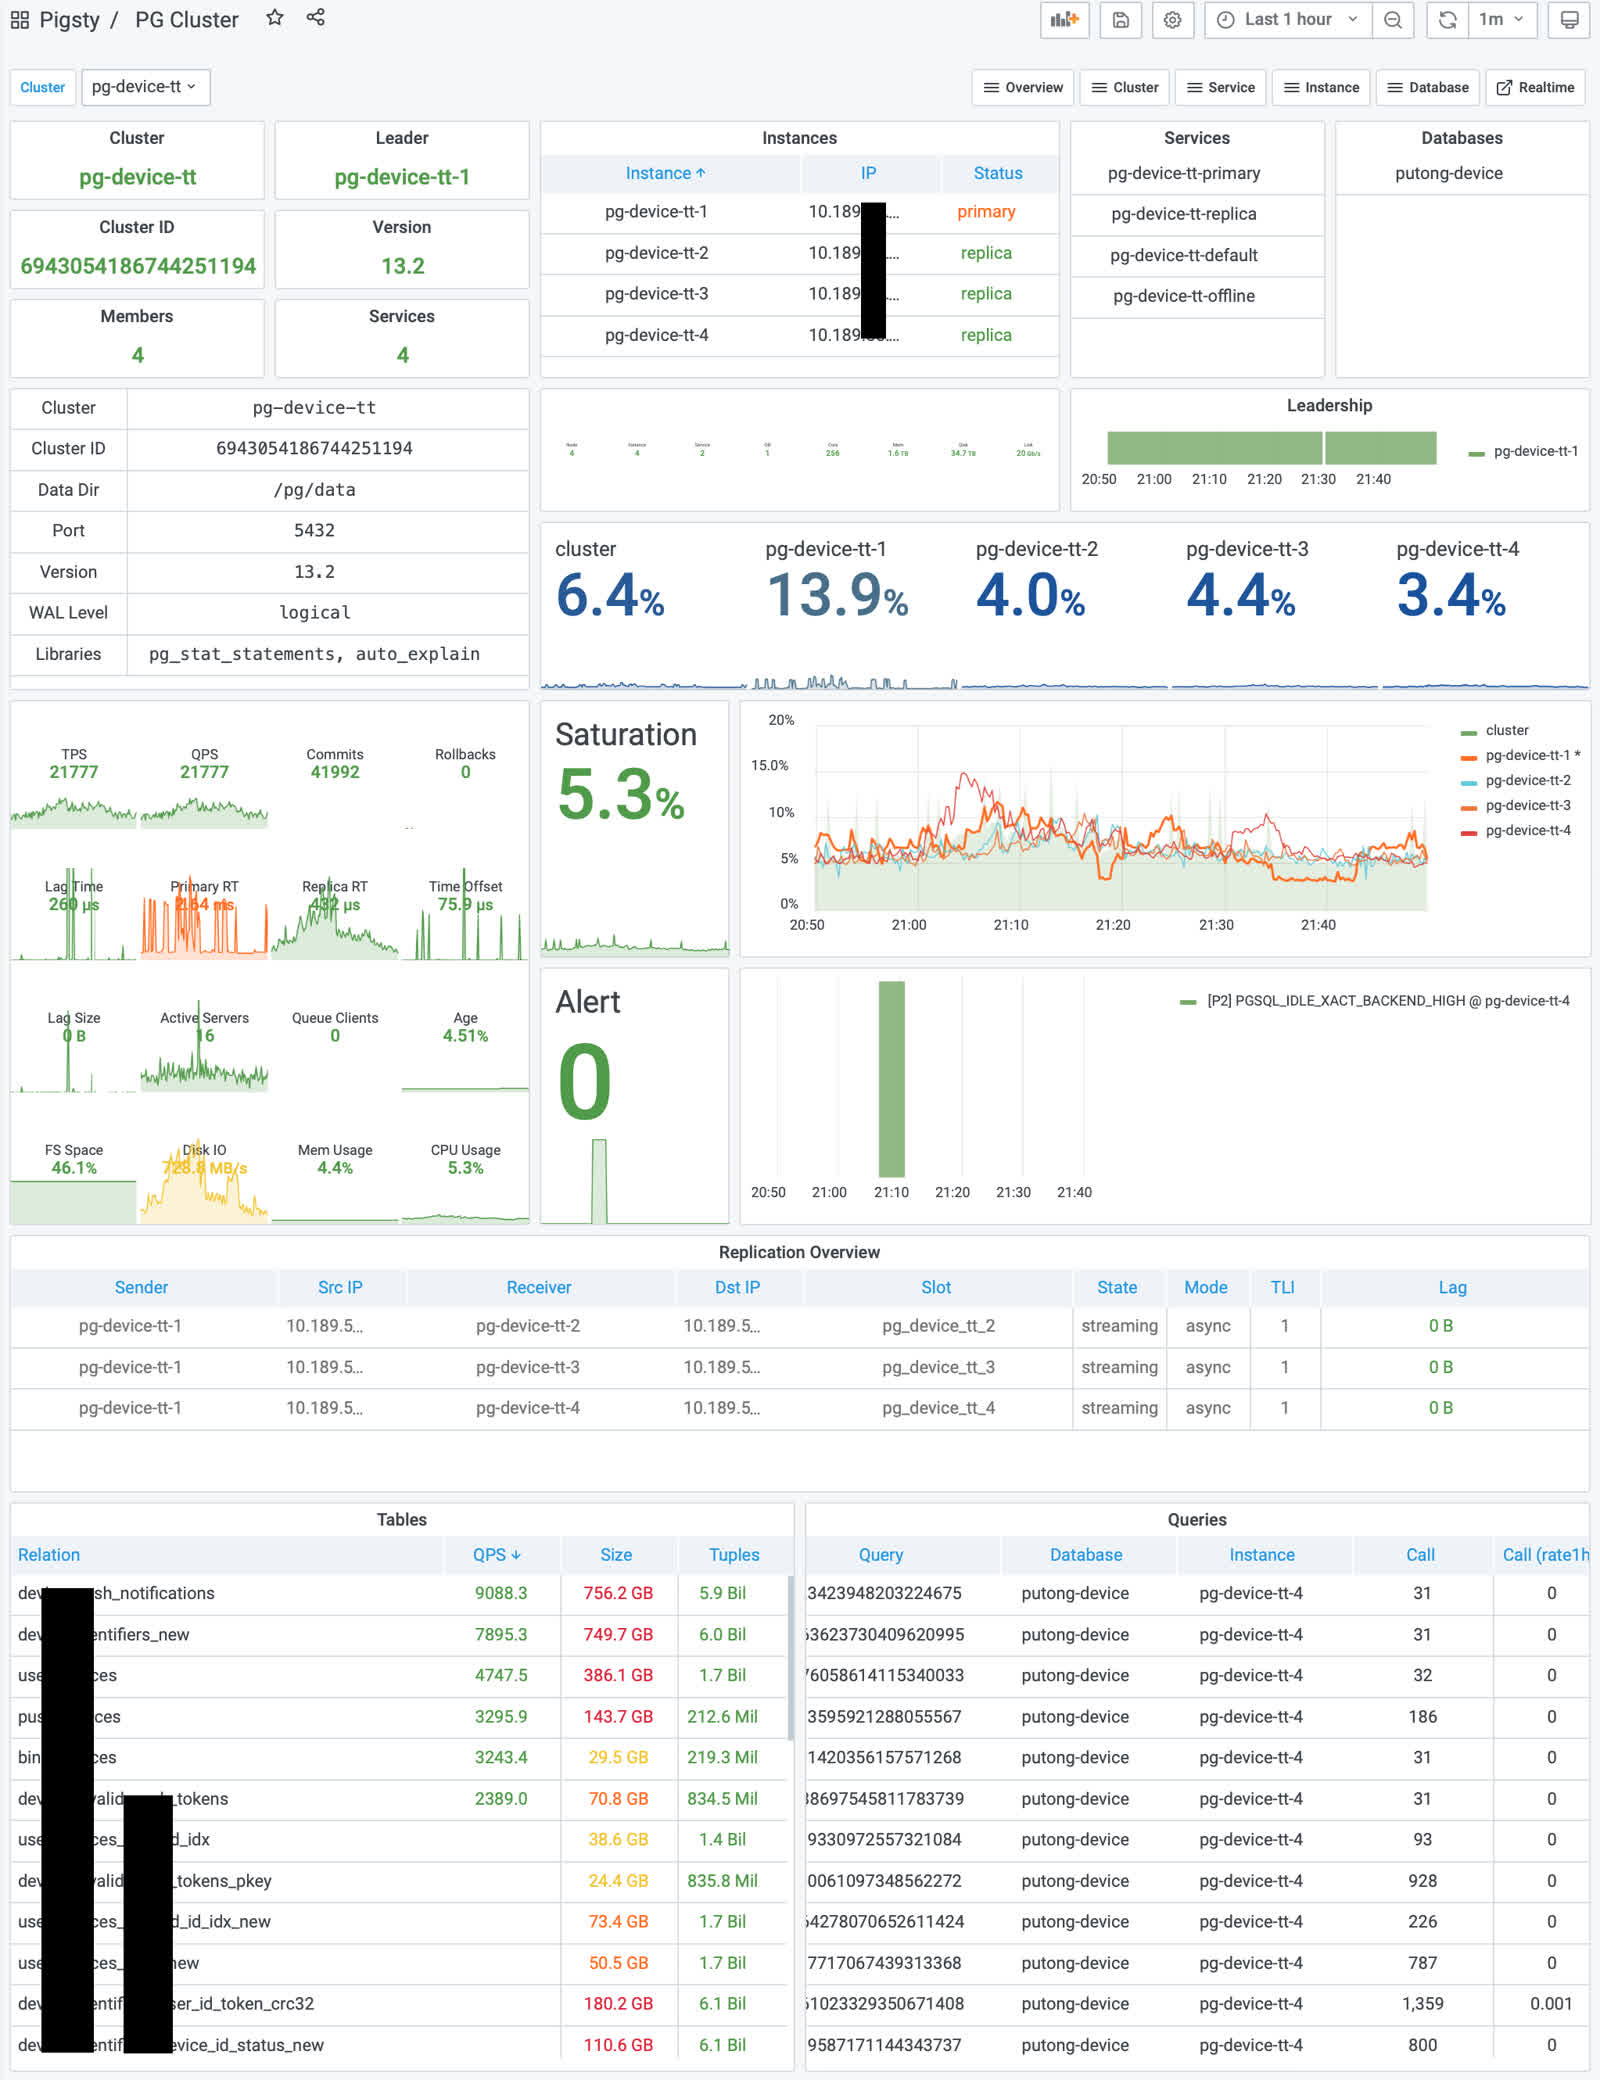
Cluster level montoring could be the most commonly used Dashboards because cluster is the basic business unit. so the most complete and comprehensive information is aggregated at the cluster level.
Most monitoring charts are generalizations and up-rolls of instance-level monitoring, i.e., they change from showing details within a single instance to showing information about each instance within the cluster and metrics aggregated at the cluster and service levels.
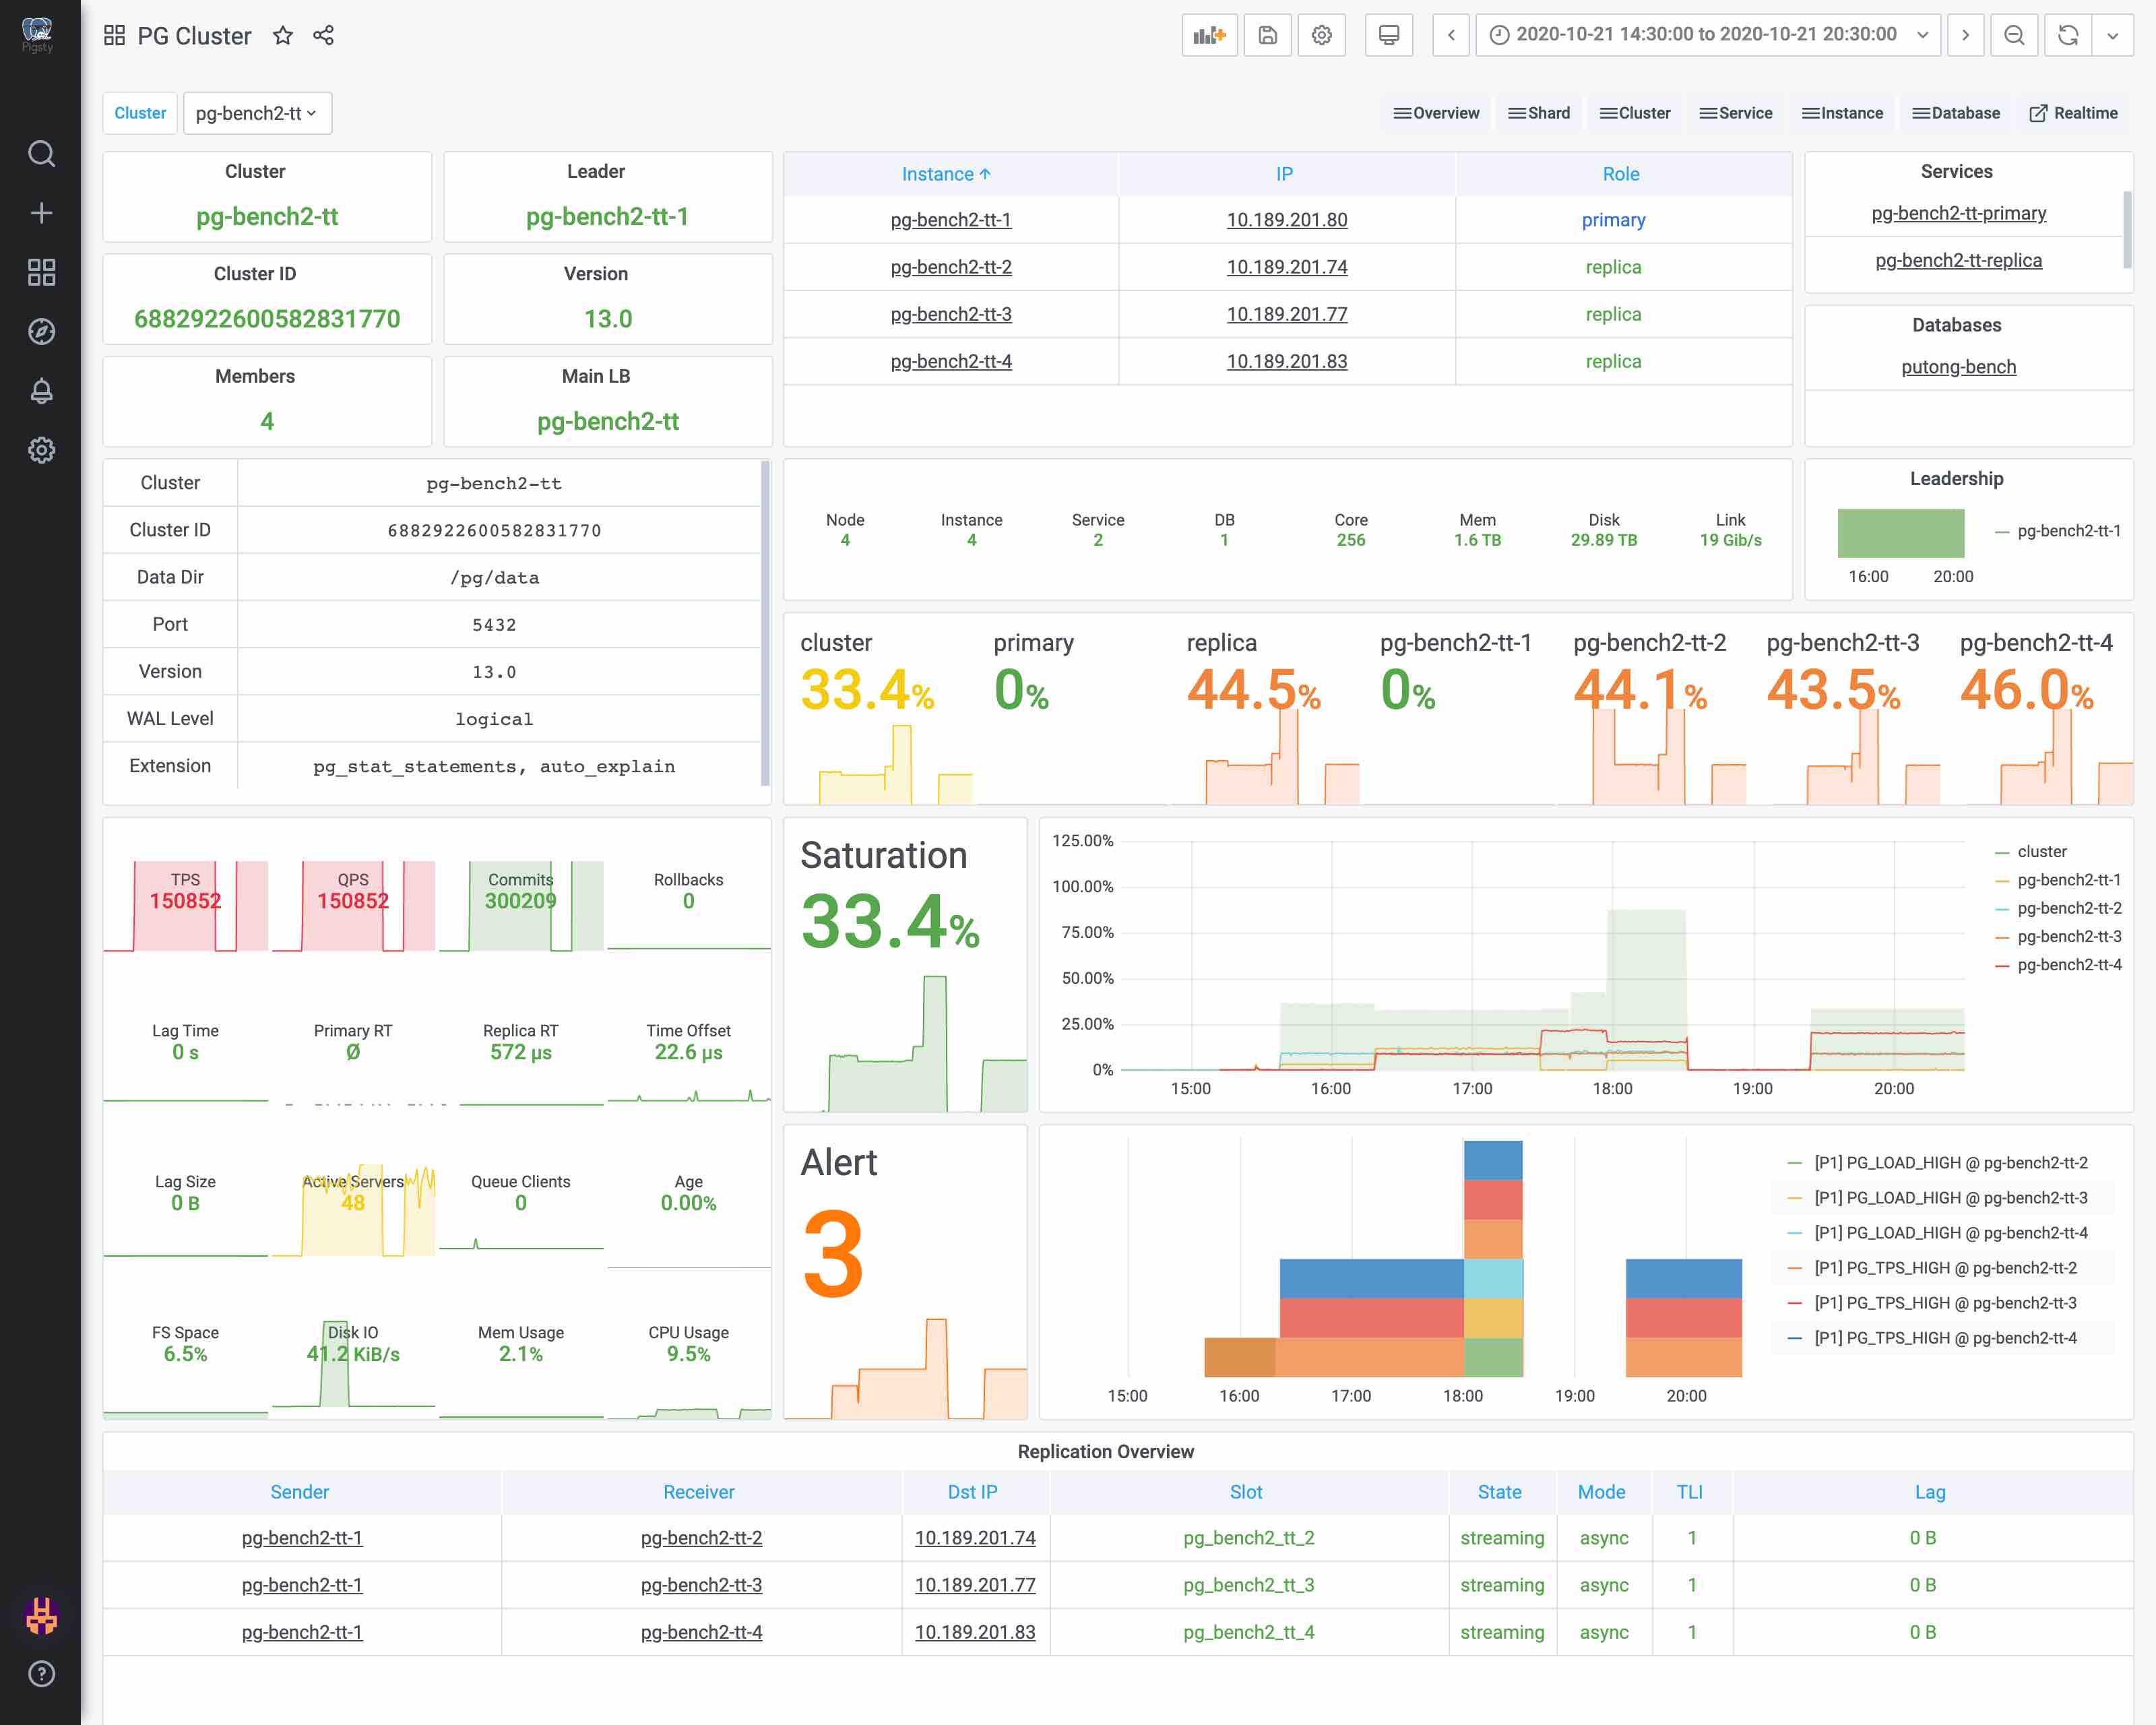
Cluster Overview
Cluster overview at Cluster level has a few more things compared to instance level.
- Timeline and leadership, when a Failover or Switchover occurs in the database, the timeline is stepped and the leadership changes.
- Cluster Topology, the cluster topology shows the replication topology in the cluster and the replication method used (synchronous/asynchronous).
- Cluster Load, which includes the load of the entire cluster in real time, 1 minute, 5 minutes, 15 minutes. and Load1 of each node in the cluster
- Cluster alarms and events.
1 - PG Cluster
PG Cluster面板简介
PG Cluster 关注单个集群的整体情况,并提供到其他集群信息的导航。
DB监控:PG集群
PG集群监控是最常用的Dashboard,因为PG以集群为单位提供服务,因此Cluster集合了最完整全面的信息。
大多数监控图都是实例级监控的泛化与上卷,即从展示单个实例内的细节,变为展现集群内每个实例的信息,以及集群和服务层次聚合后的指标。
集群概览
Cluster级别的集群概览相比实例级别多了一些东西:
- 时间线与领导权,当数据库发生Failover或Switchover时,时间线会步进,领导权会发生变化。
- 集群拓扑,集群拓扑展现了集群中的复制拓扑,以及采用的复制方式(同步/异步)。
- 集群负载,包括整个集群实时、1分钟、5分钟、15分钟的负载情况。以及集群中每个节点的Load1
- 集群报警与事件。

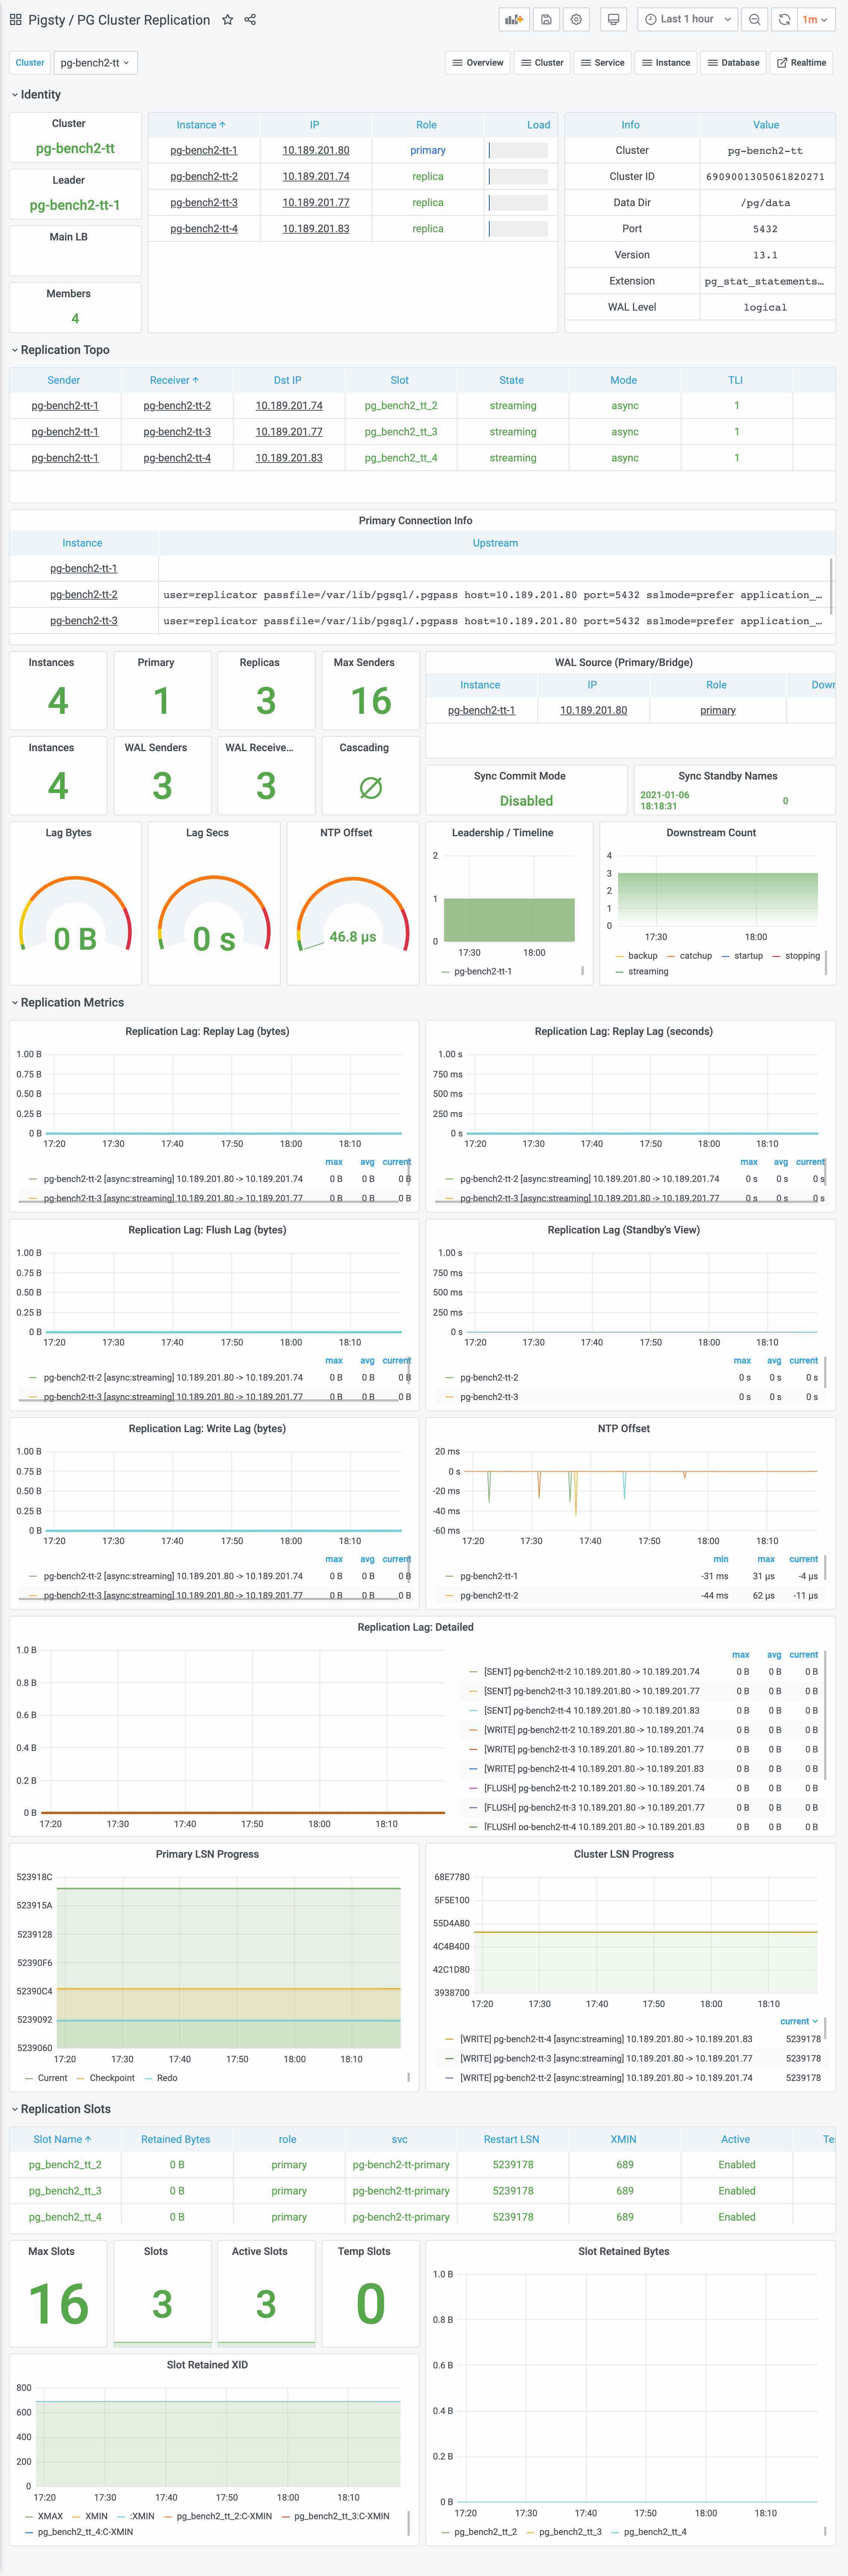
集群复制
Cluster级别的Dashboard与Instance级别Dashboard最重要的区别之一就是提供了整个集群的复制全景。包括:
-
集群中的主库与级联桥接库。集群是否启用同步提交,同步从库名称。桥接库与级联库数量,最大从库配置
-
成对出现的Walsender与Walreceiver列表,体现一对主从关系的复制状态
-
以秒和字节衡量的复制延迟(通常1秒的复制延迟对应10M~100M不等的字节延迟),复制槽堆积量。
-
从库视角的复制延迟
-
集群中从库的数量,备份或拉取从库时可以从这里看到异常。
-
集群的LSN进度,用于整体展示集群的复制状态与持久化状态。

节点指标
PG机器的相关指标,按照集群进行聚合。

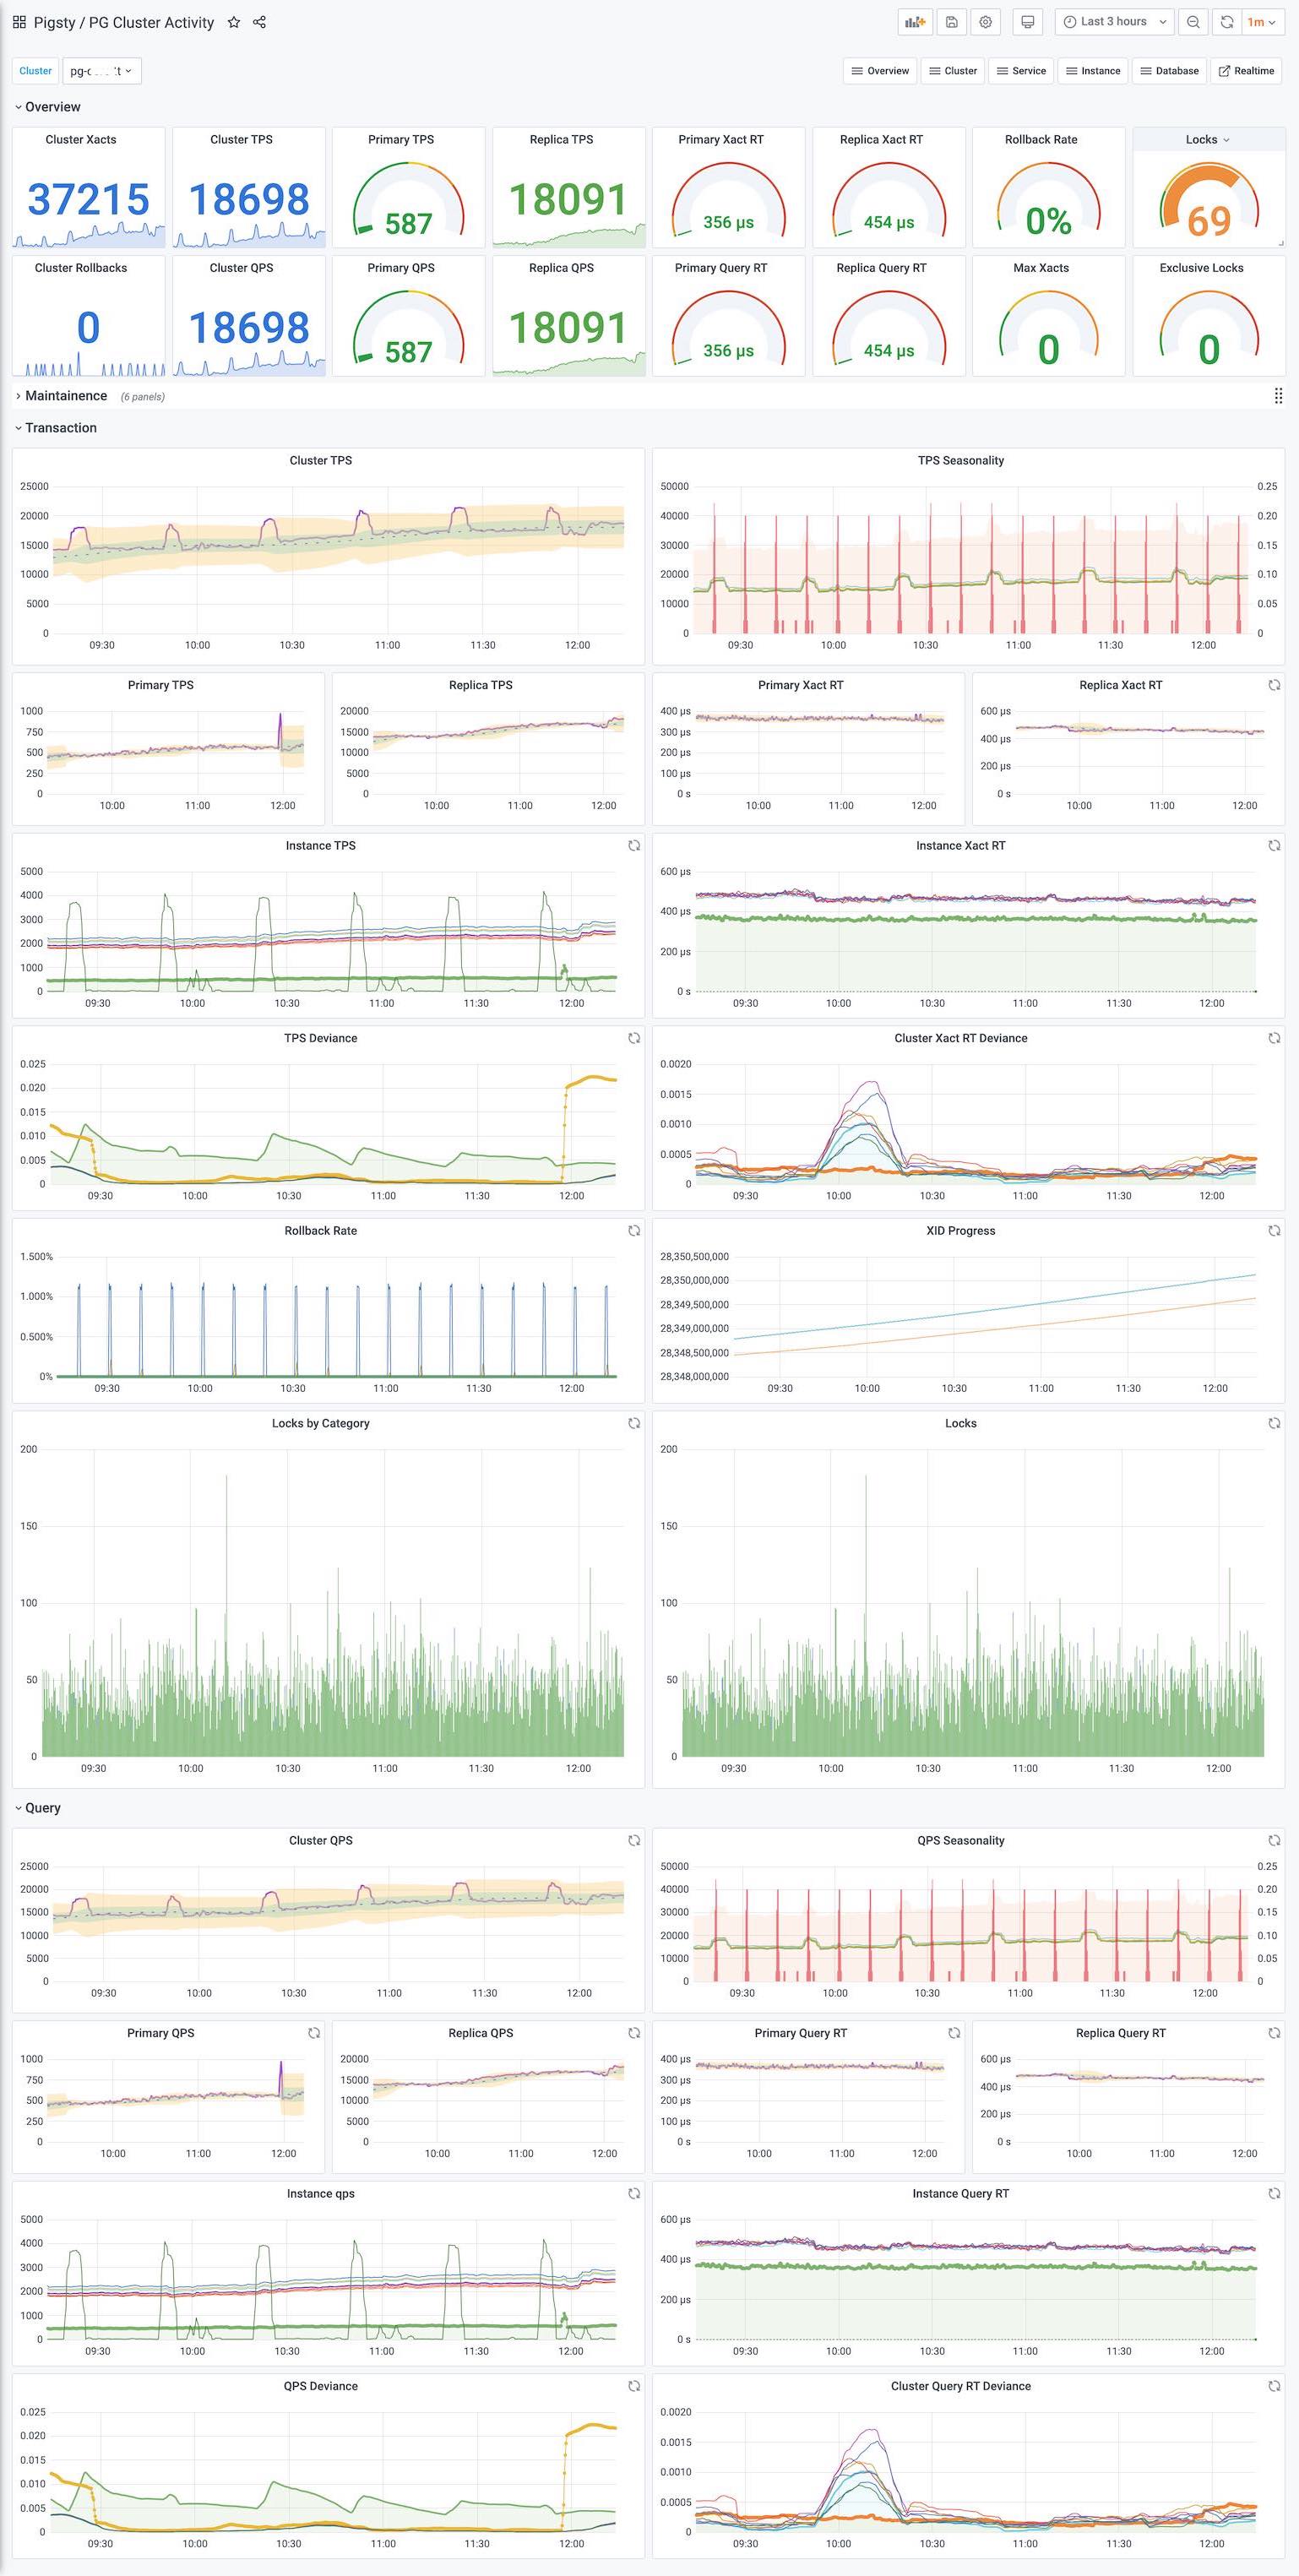
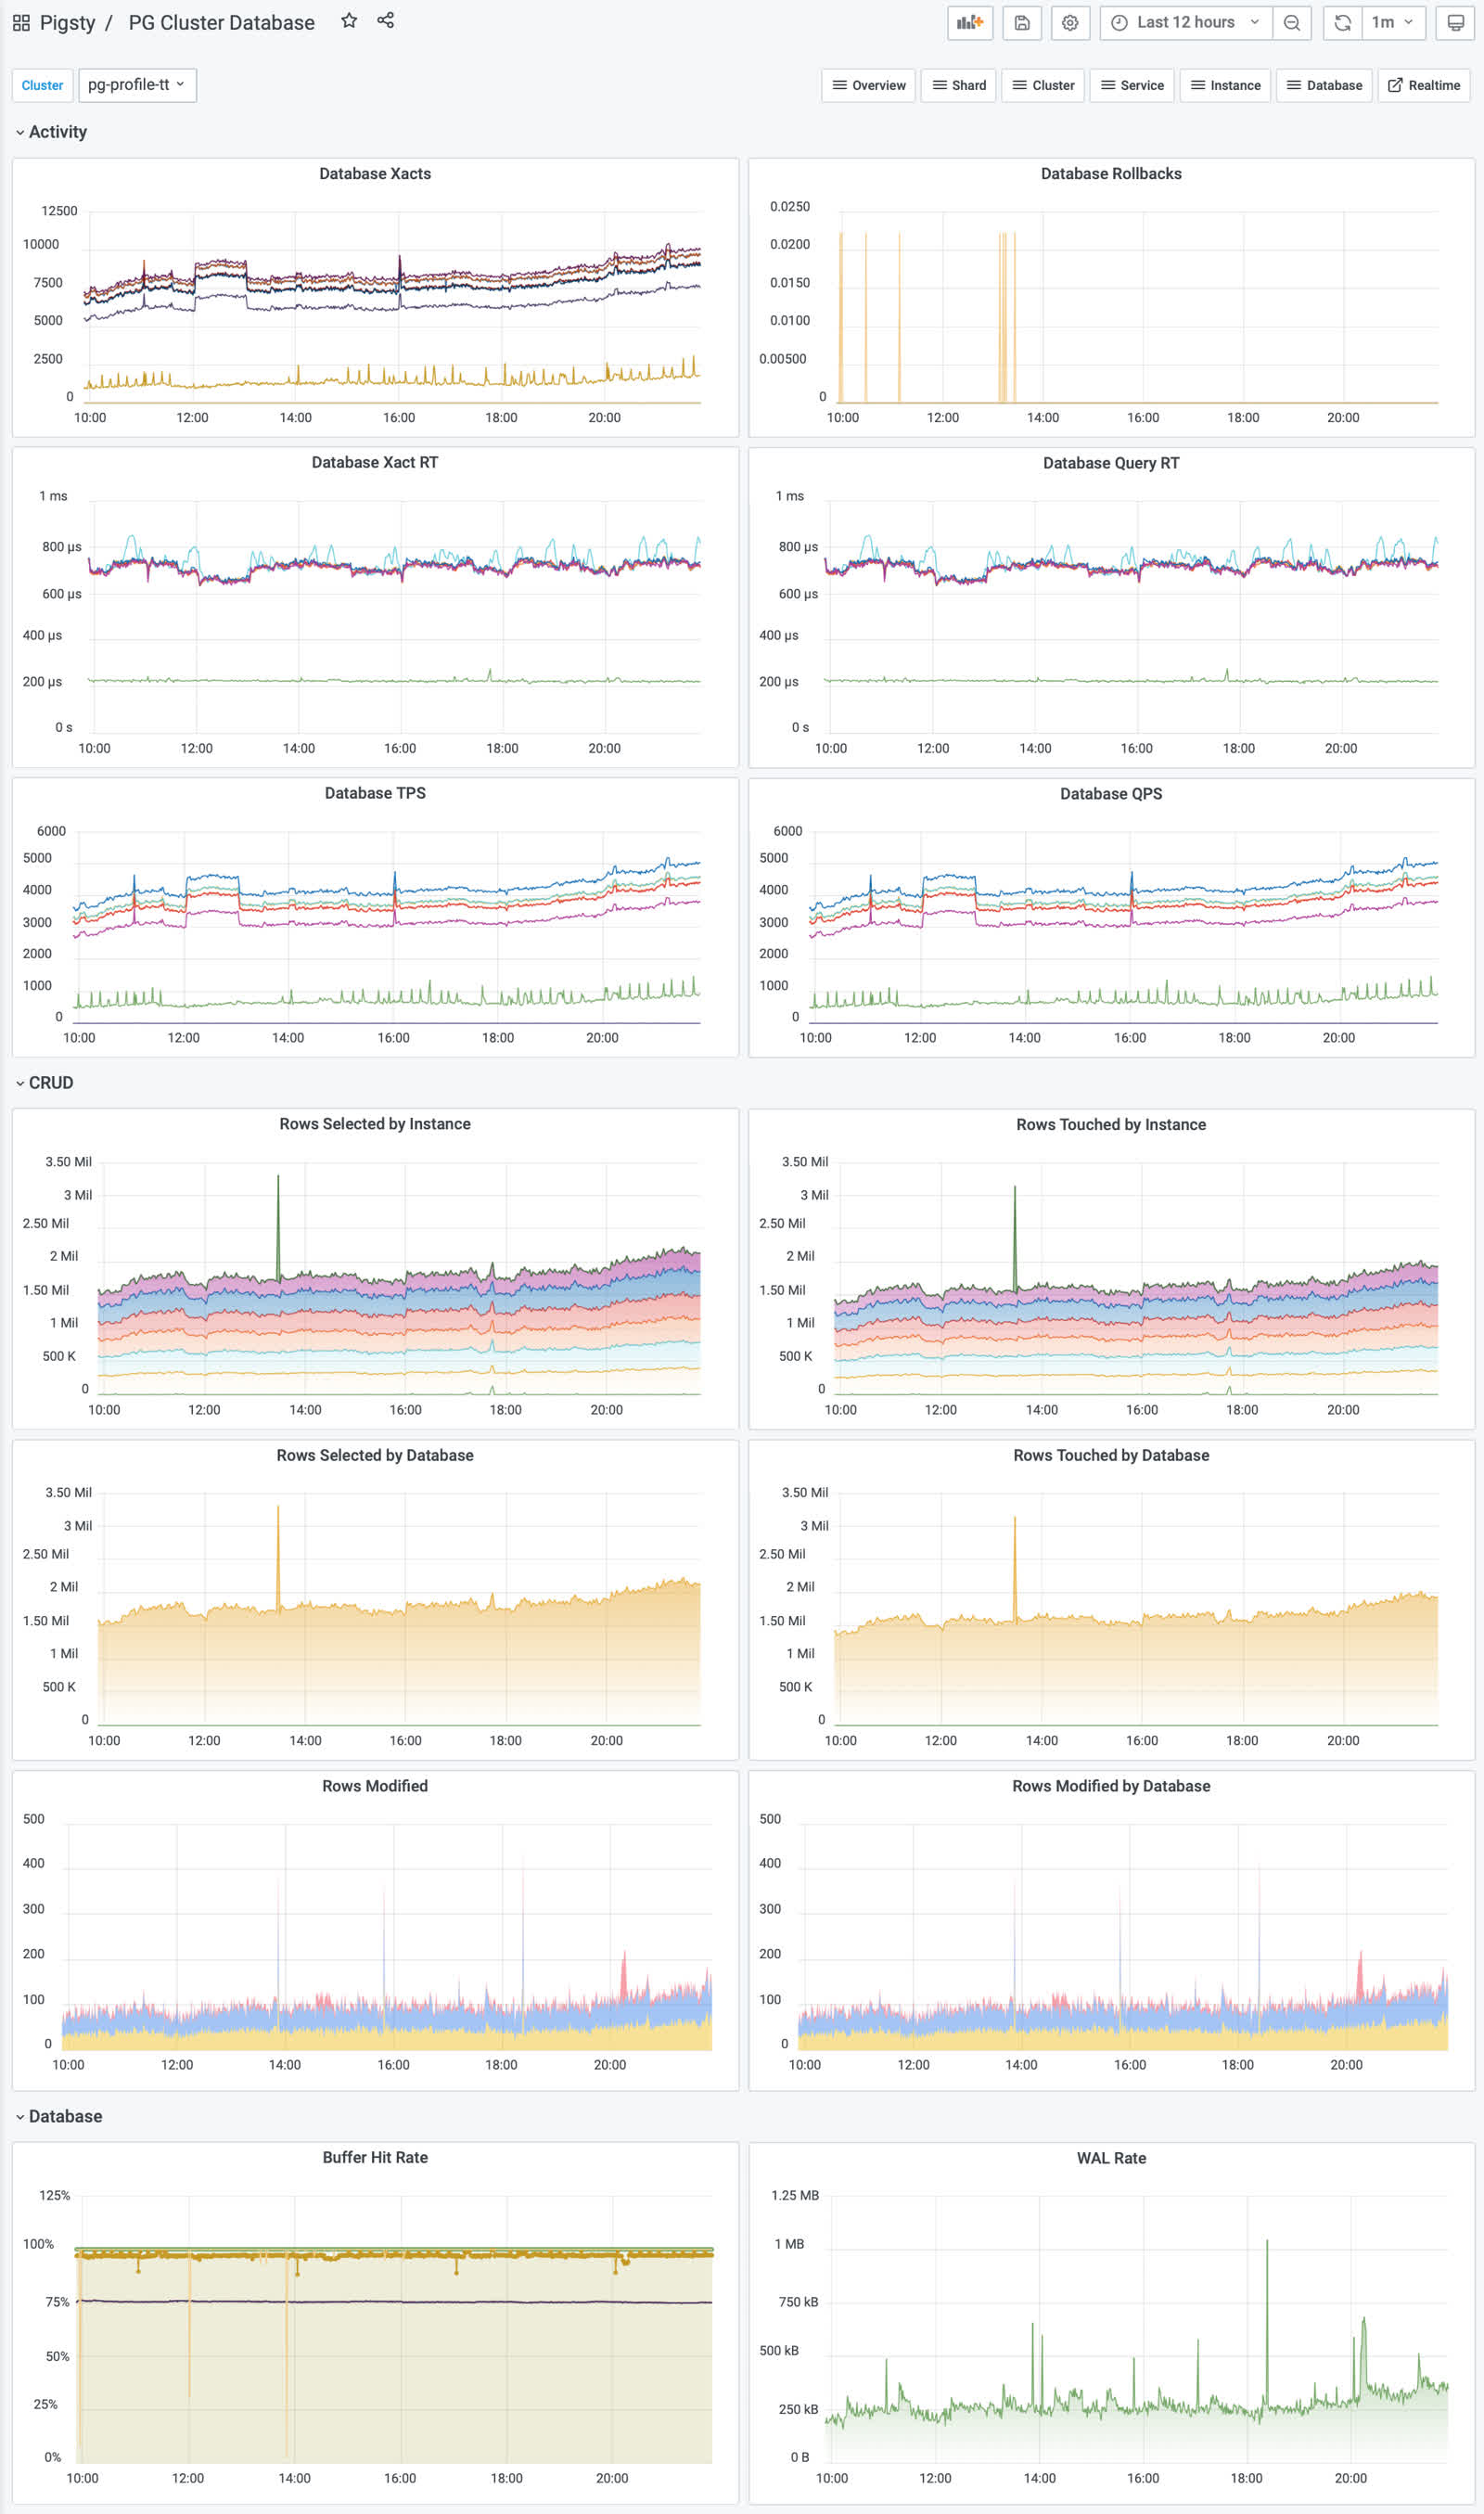
事务与查询
与实例级别的类似,但添加了Service层次的聚合(一个集群通常提供primary与standby两种Service)。

其他指标与实例级别差别不大。
2 - PG Cluster Replication
PG Cluster Replication 关注单个集群内的复制活动。
PG Cluster Replication 关注单个集群内的复制活动。
3 - PG Cluster Activity
PG Cluster Activity 关注特定集群的活动状态,包括事务,查询,锁,等等。
PG Cluster Activity 关注单个集群的活动,包括事务,查询,锁,等等。
4 - PG Cluster Session
PG Cluster Session 关注特定集群中连接、连接池的工作状态。
PG Cluster Session 关注特定集群中连接、连接池的工作状态。

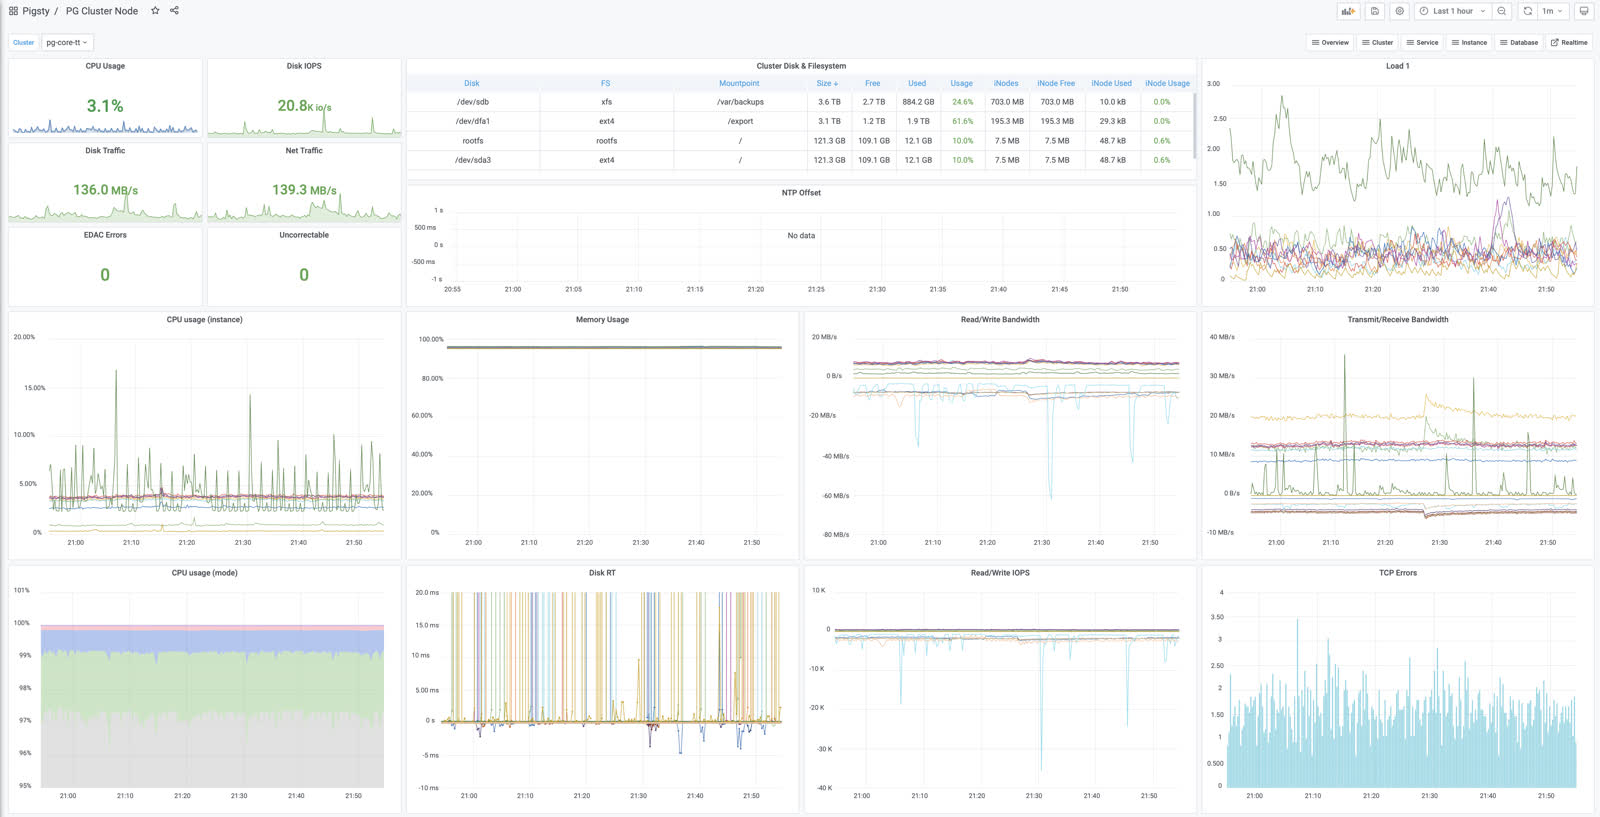
5 - PG Cluster Node
PG Cluster Node关注整个集群的机器资源使用情况
PG Cluster Node关注整个集群的机器资源使用情况
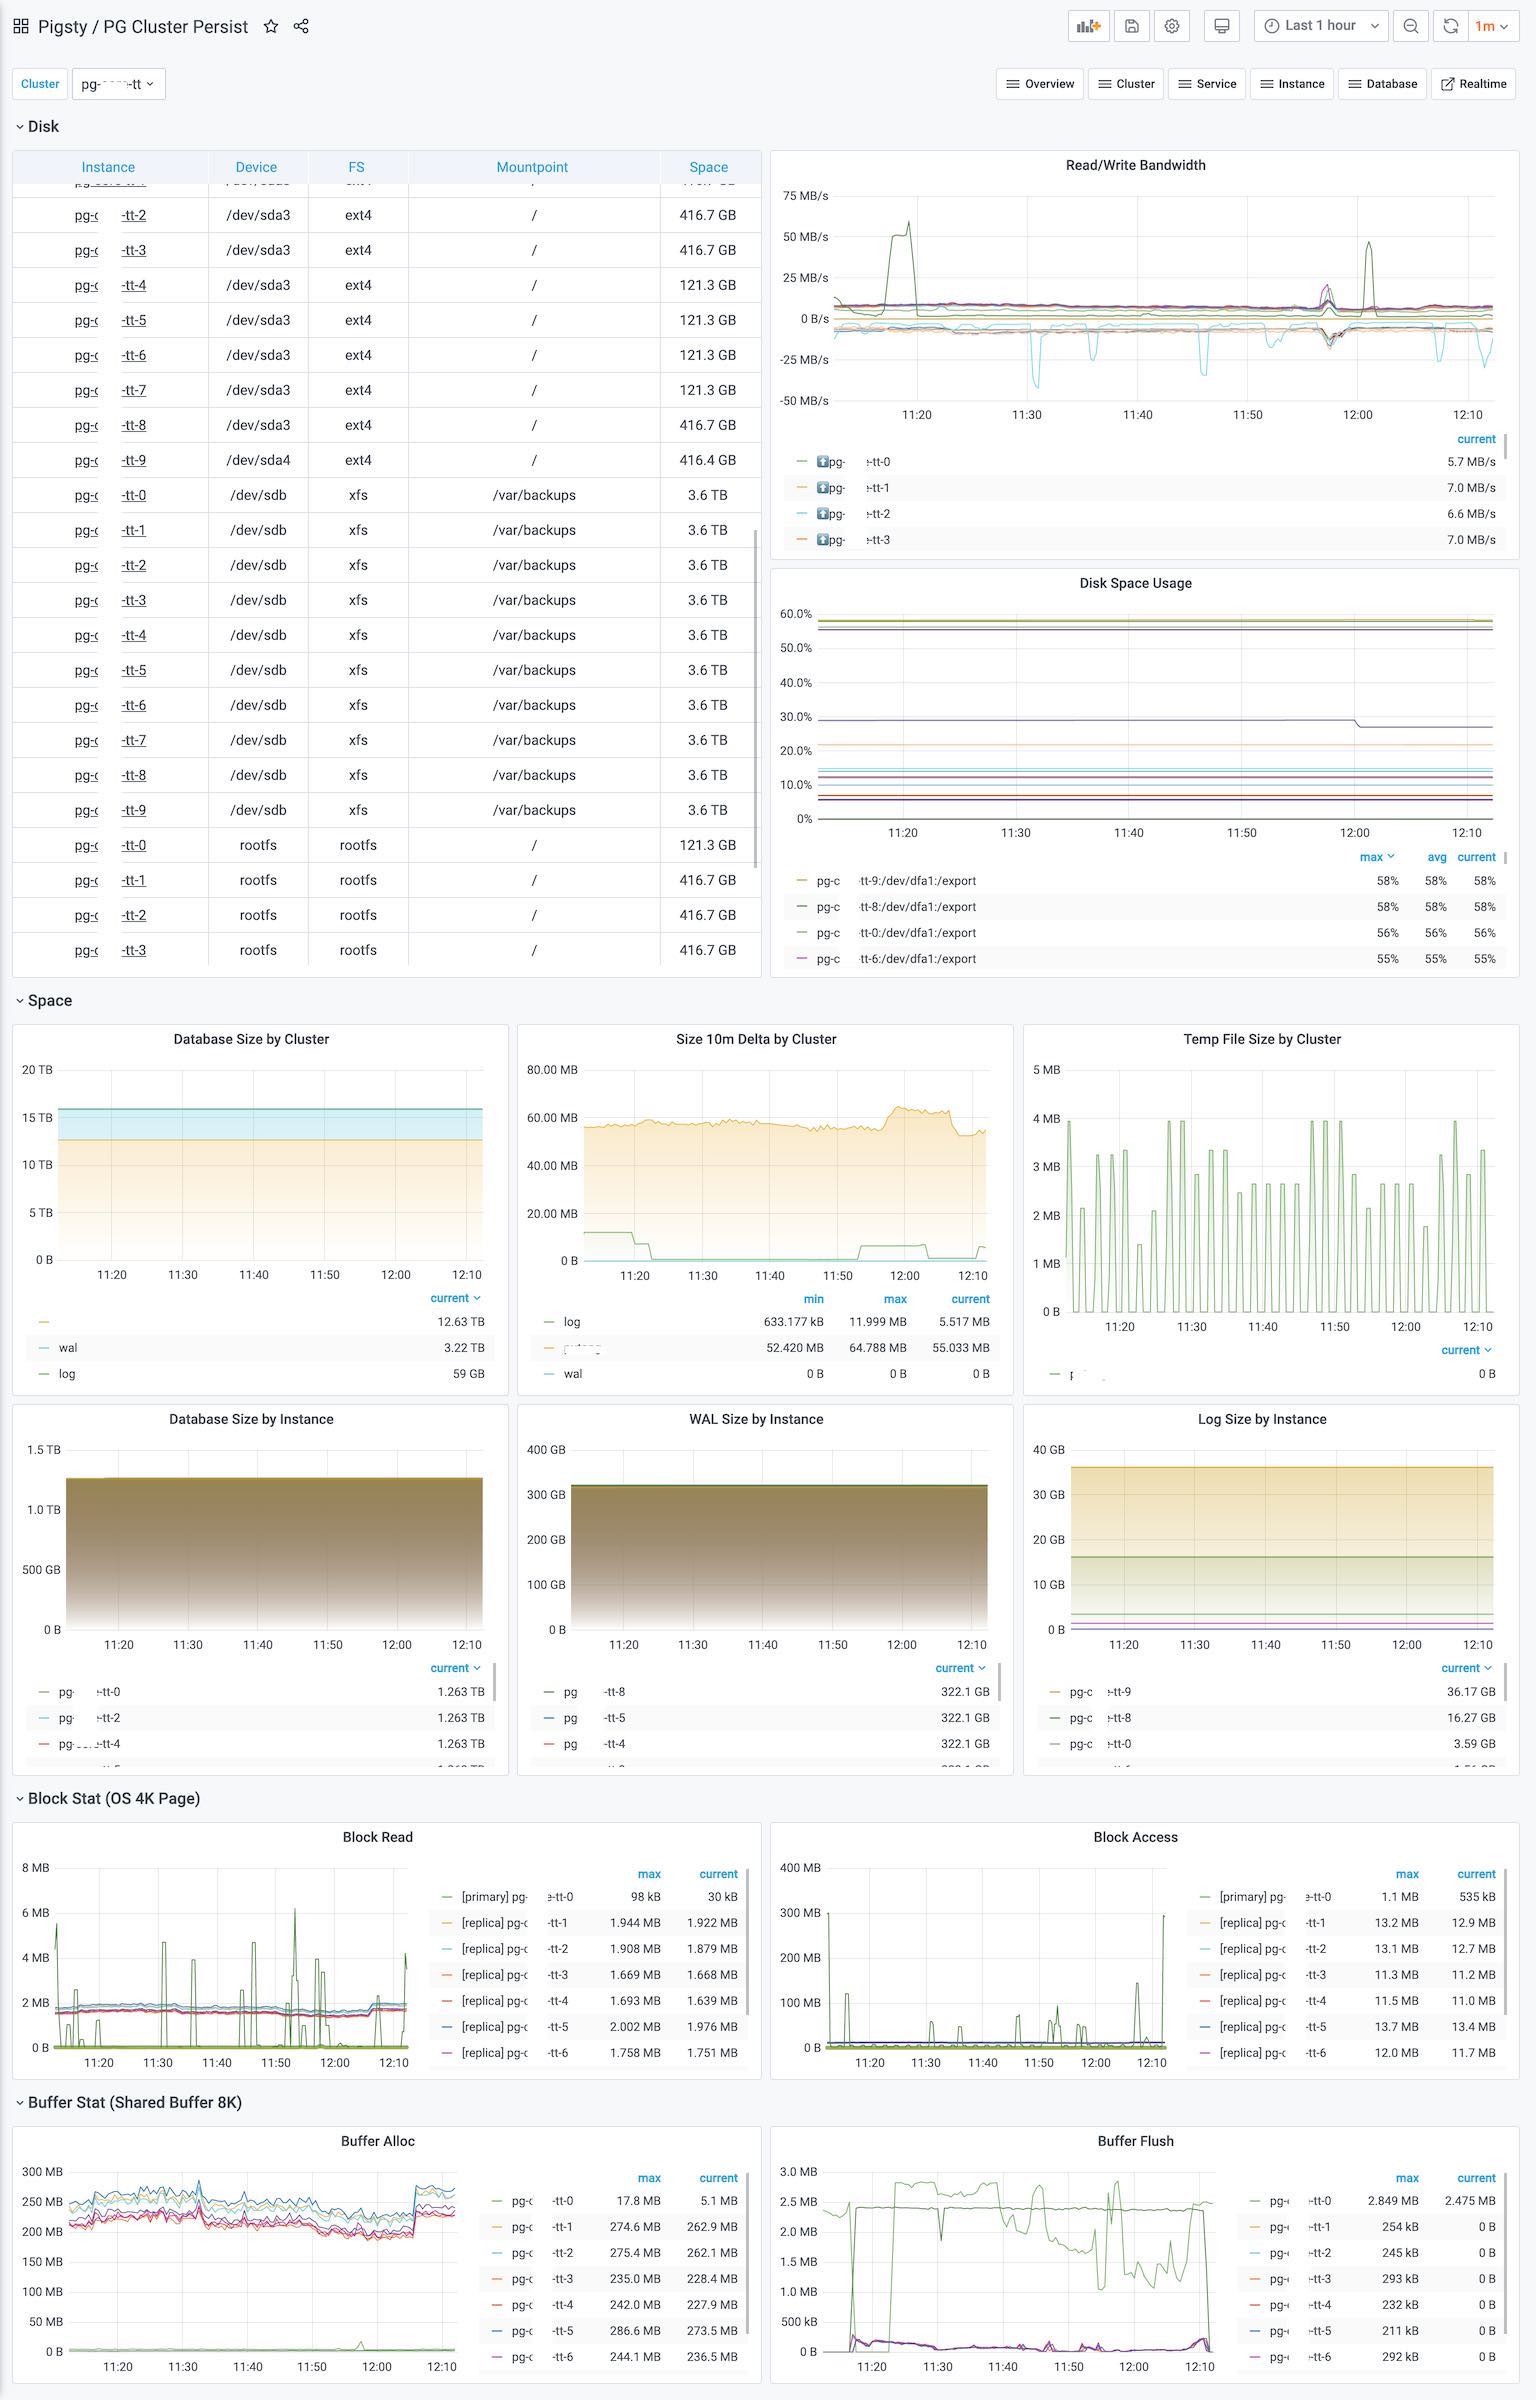
6 - PG Cluster Persist
PG Cluster Persist 关注集群的持久化,检查点与IO状态。
PG Cluster Persist 关注集群的持久化,检查点与IO状态。
7 - PG Cluster Database
PG Cluster Database 关注特定集群中与数据库有关的指标:TPS,增删改查,年龄等。
PG Cluster Activity 关注单个集群的活动,包括事务,查询,锁,等等。
8 - PG Cluster Stat
PG Cluster Stat 用于展示集群在过去一段统计周期内的用量信息
PG Cluster Stat 用于展示集群在过去一段统计周期内的用量信息


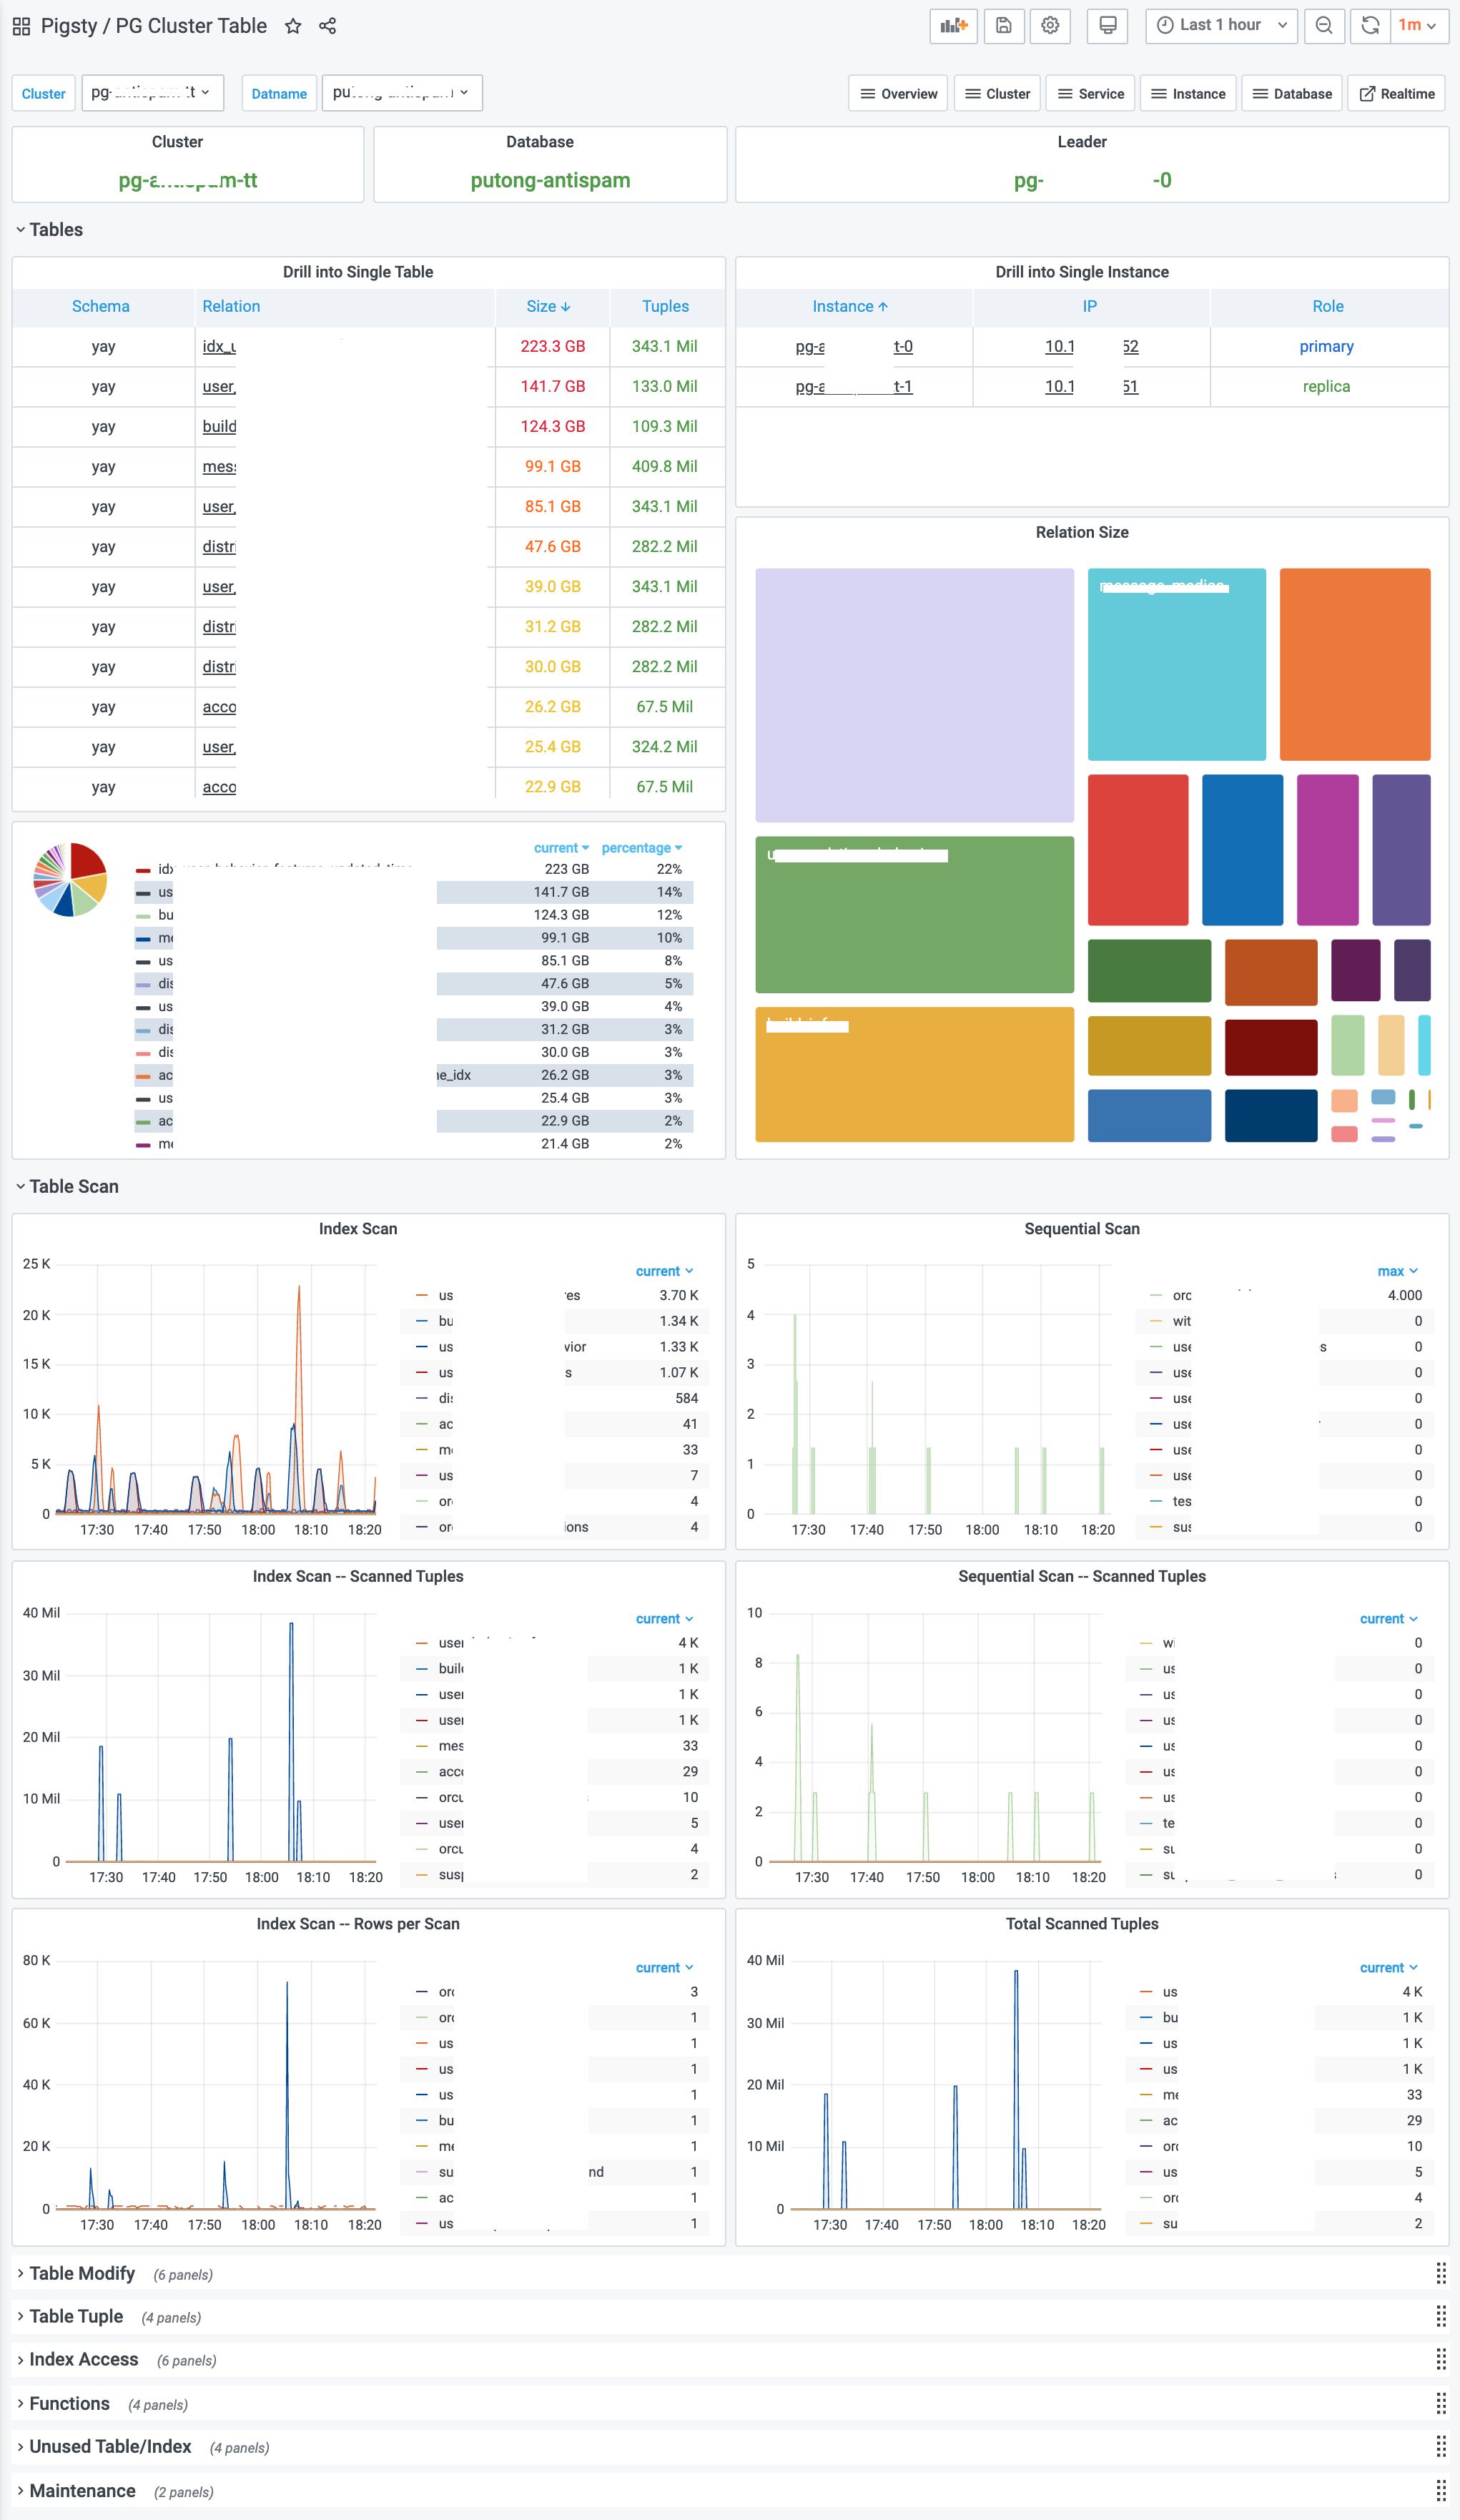
9 - PG Cluster Table
PG Cluster Table 关注单个集群中所有表的增删改查情况
PG Cluster Table 关注单个集群中所有表的增删改查情况
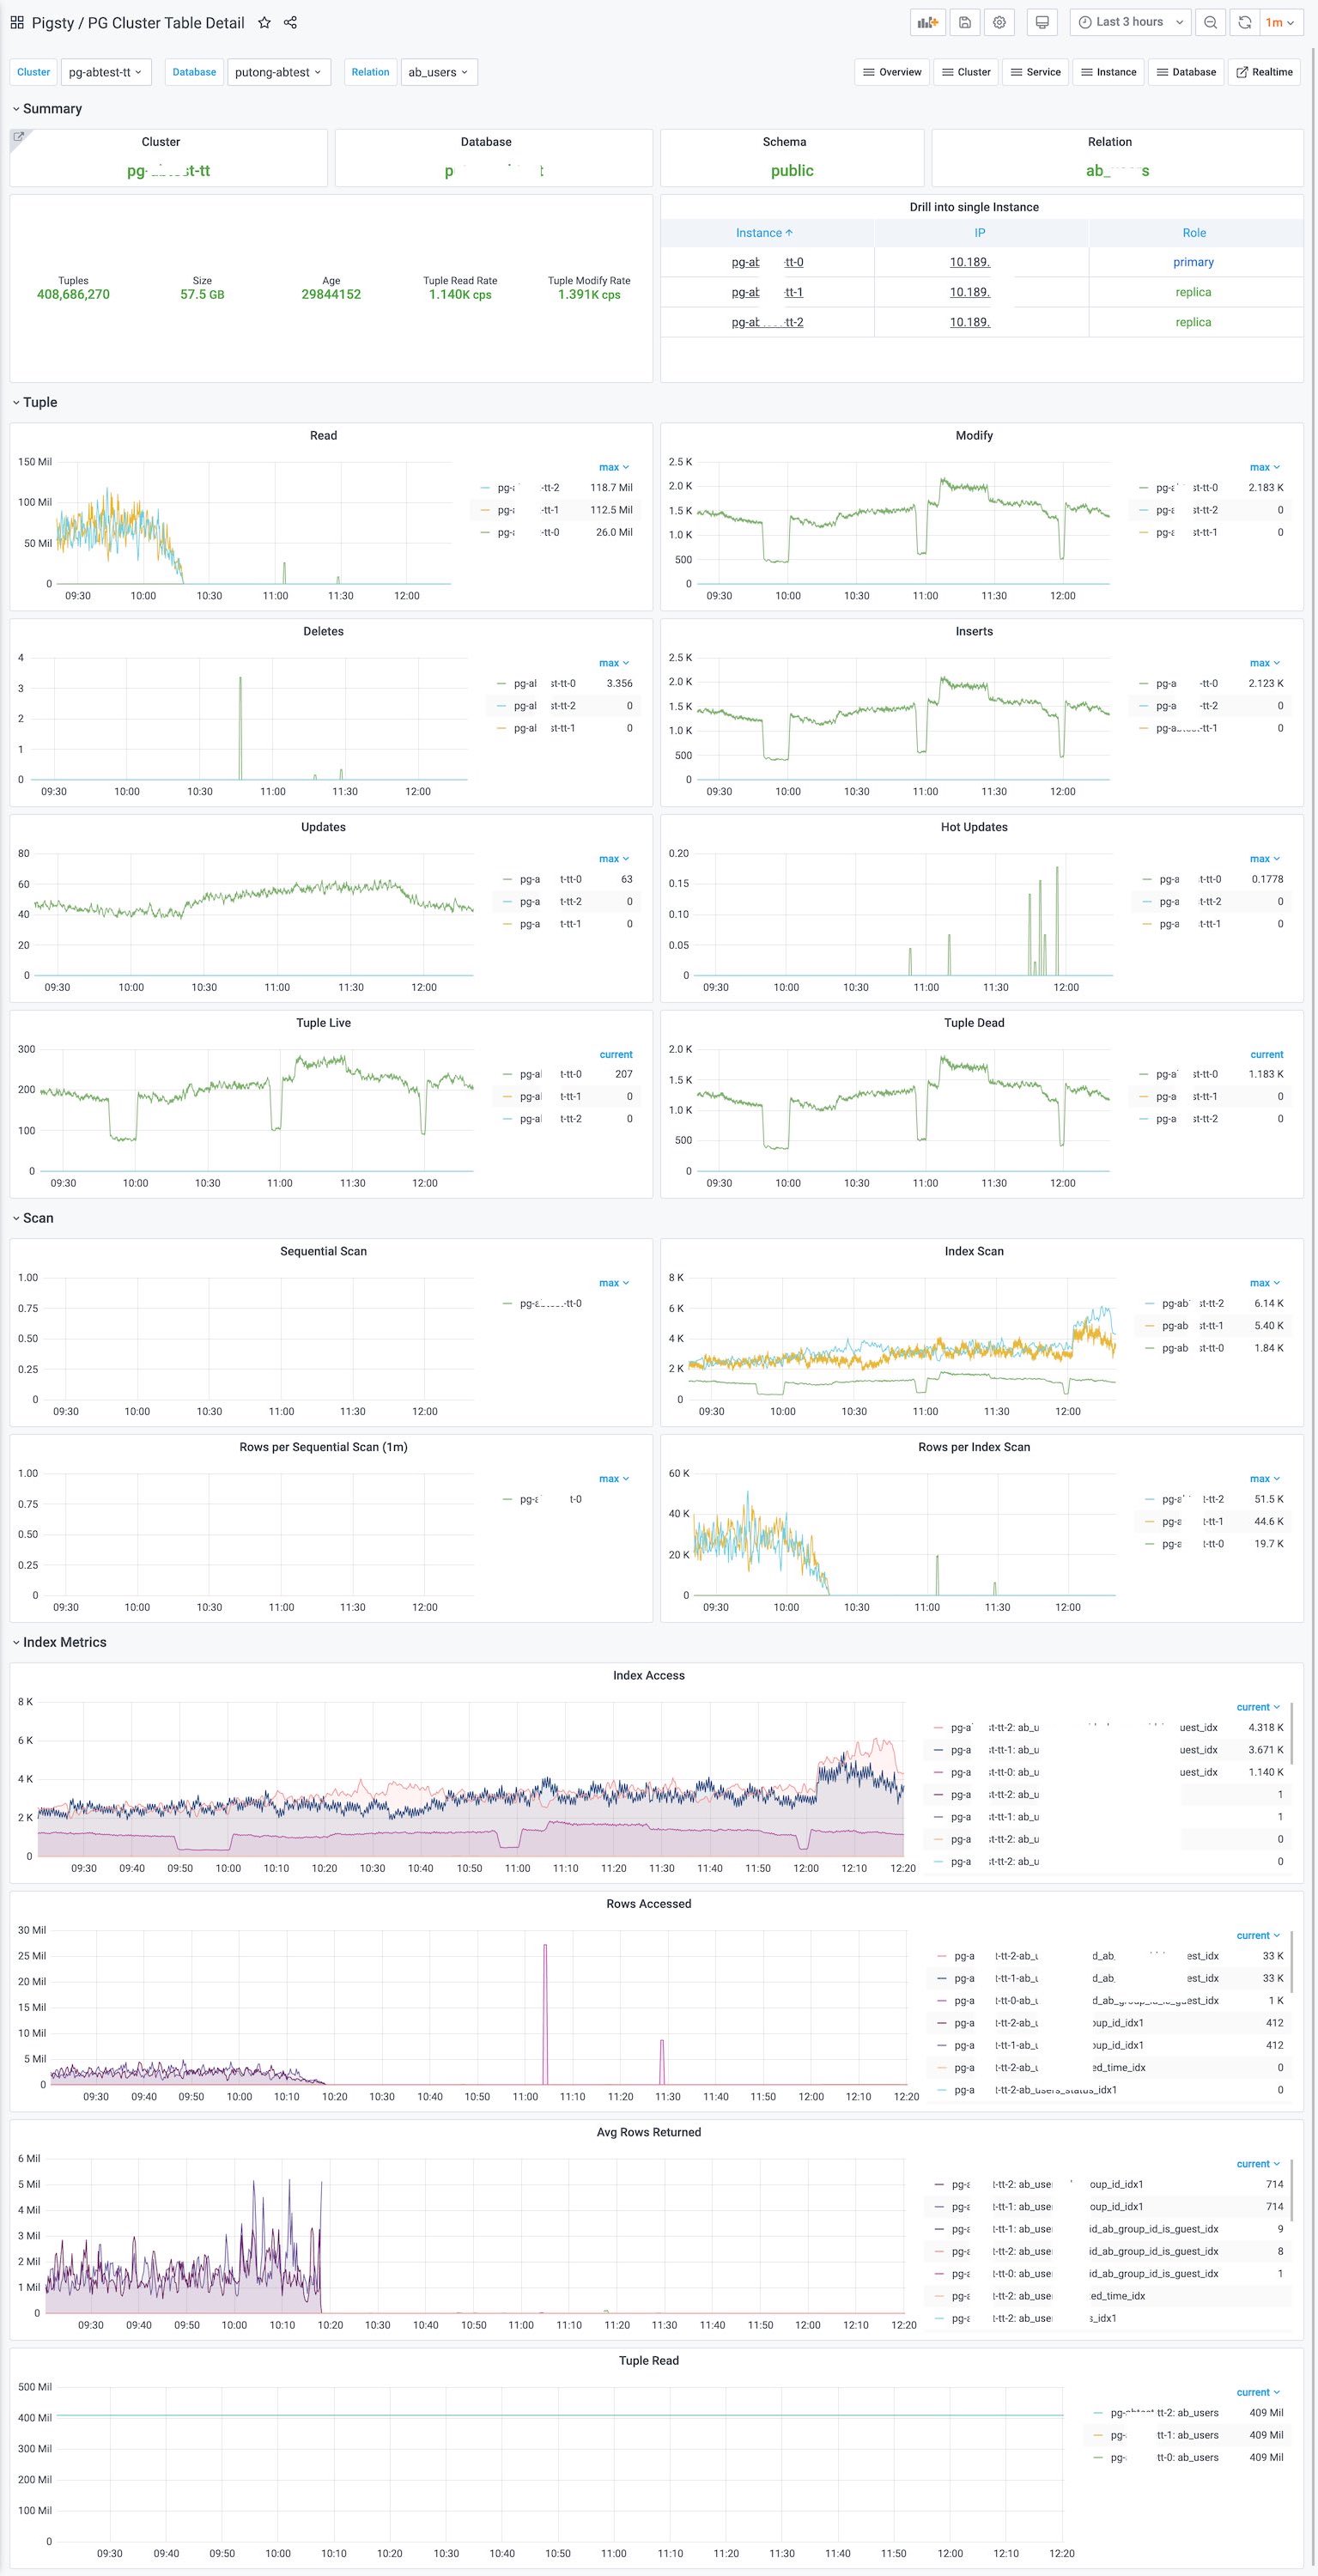
10 - PG Cluster Table Detail
PG Cluster Table Detail关注单个集群中某张特定表的增删改查情况
PG Cluster Table Detail关注单个集群中某张特定表的增删改查情况
您可以从该面板跳转到
- PG Cluster Table: 上卷至集群中的所有表
- PG Instance Table Detail:查看这张表在集群中的单个特定实例上的详细状态。
11 - PG Cluster Query
PG Cluster Query 关注特定集群内所有的查询状况
PG Cluster Query 关注特定集群内所有的查询状况
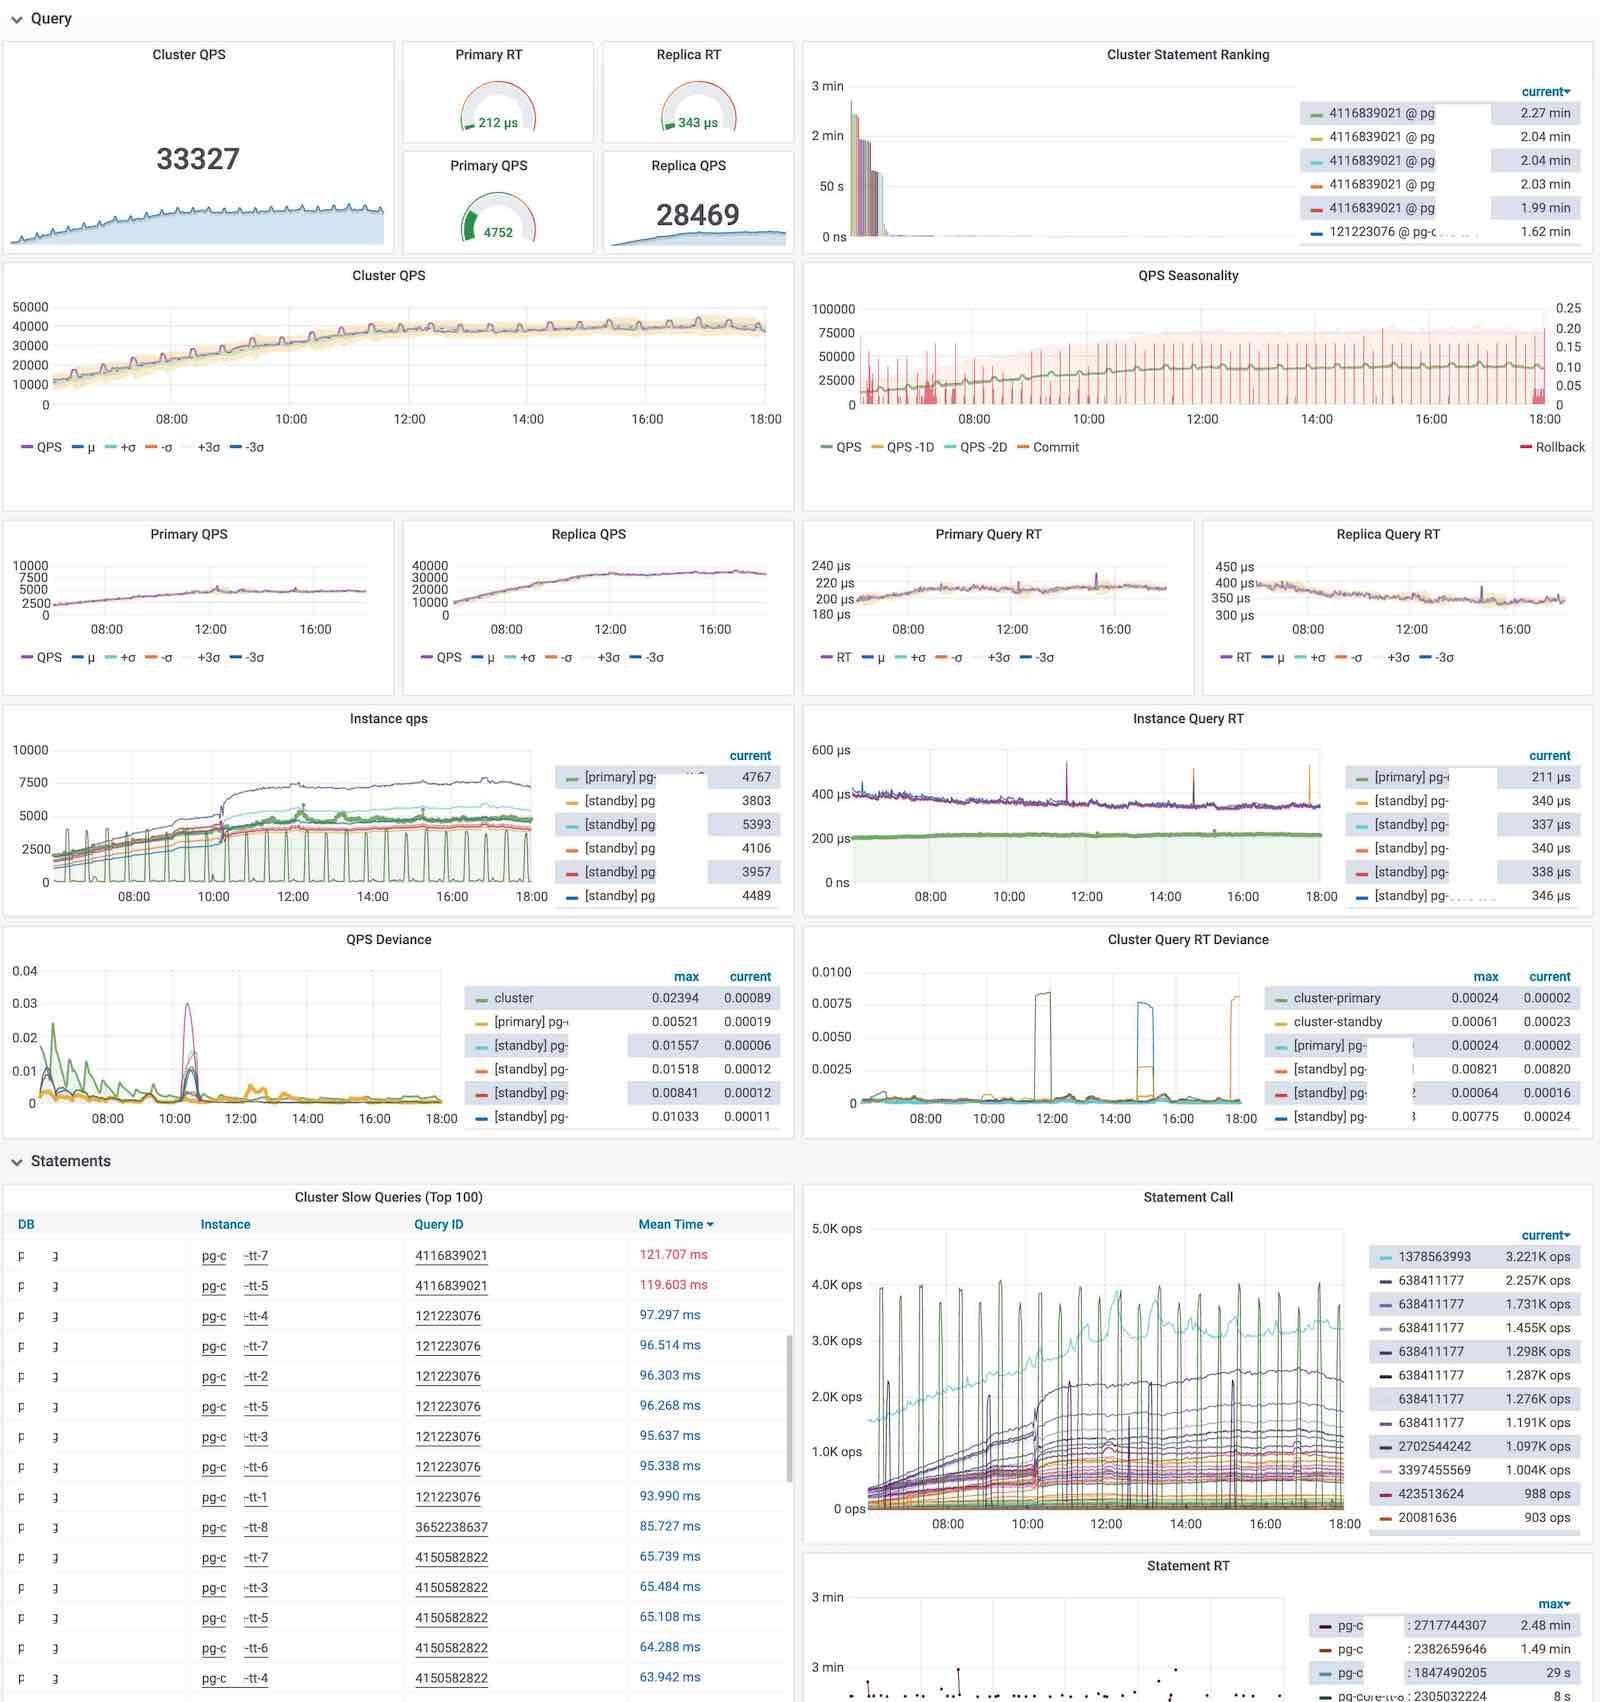
DB监控:PG慢查询平台
显示慢查询相关的指标,上方是本实例的查询总览。鼠标悬停查询ID可以看到查询语句,点击查询ID会跳转到对应的查询细分指标页(Query Detail)。
- 左侧是格式化后的查询语句,右侧是查询的主要指标,包括
- 每秒查询数量:QPS
- 实时的平均响应时间(RT Realtime)
- 每次查询平均返回的行数
- 每次查询平均用于BlockIO的时长
- 响应时间的均值,标准差,最小值,最大值(自从上一次统计周期以来)
- 查询最近一天的调用次数,返回行数,总耗时。以及自重置以来的总调用次数。
- 下方是指定时间段的查询指标图表,是概览指标的细化。
12 - PG Cluster Health
PG Cluster Health基于规则对集群进行健康度评分
PG Cluster Health基于规则对集群进行健康度评分。

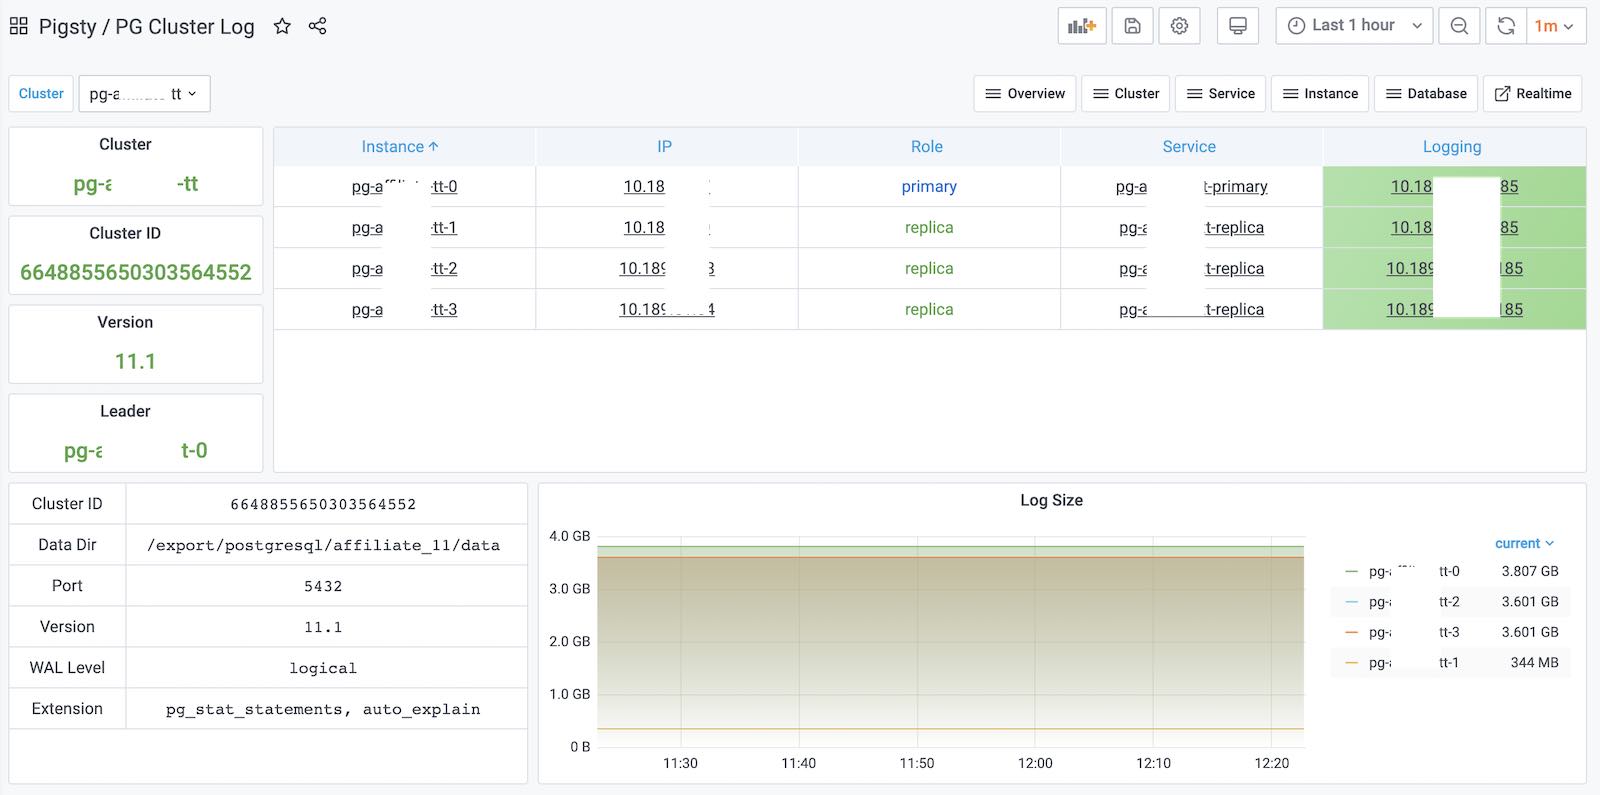
13 - PG Cluster Log
PG Cluster Log面板简介
PG Cluster Log 关注单个集群内的所有日志事件。
该面板提供了到外部的日志摘要平台的连接,这是一个Pigsty高级特性,仅在企业版中提供。
14 - PG Cluster All
PG Cluster All 包含了集群中所有的监控信息,用于细节对比与分析。
PG Cluster All 包含了集群中所有的监控信息,用于细节对比与分析。
