Concept
Some critical information about pigsty
Pigsty is logically composed of two parts: monitoring system and provisioning solution.
The monitoring system is responsible for monitoring the PostgreSQL database cluster, and the provisioning solution is responsible for creating the PostgreSQL database cluster. Before understanding Pigsty’s monitoring system and provisioning solution, it is helpful to read naming principles and overall architecture to get an intuitive picture of the overall design.
Pigsty’s monitoring system and provisioning solution can be used independently, and users can use Pigsty monitoring system to monitor existing PostgreSQL clusters and instances without using Pigsty provisioning solution, check Monitor-only deployment.
Monitoring System
You can’t manage what you don’t measure.
Pigsty delivers the best open source PostgreSQL monitoring system.
Pigsty’s monitoring system is physically divided into two parts.
- server: deployed on meta-node, including services such as Prometheus, a timing database, Grafana, a monitoring dashboard, Altermanager, and Consul, a service discovery.
- Client: deployed on [Database Node](arch/#Database Node), including NodeExporter, PgExporter, Haproxy. passively accept Prometheus pull, on.
The core concepts of the Pigsty monitoring system are as follows.
Provisioning Solution
It is better to teach a man how to fish rather than give him a fish
Provisioning Solution (Provisioning Solution) refers to a system that delivers database services and monitoring systems to users. The Provisioning Solution is not a database, but a database factory**, where the user submits a configuration to the provisioning system, and the provisioning system creates the required database cluster in the environment according to the user’s required specifications, similar to creating the various resources required by the system by submitting a YAML file to Kubernetes.
Pigsty’s provisioning solution is divided into two parts for deployment.
- Infrastructure (Infra) : Deployed on meta nodes to monitor key services such as infrastructure, DNS, NTP, DCS, local sources, etc.
- [Database Cluster](arch/# Database Cluster) (PgSQL) : Deployed on database nodes to provide database services to the outside world as a cluster.
Pigsty’s provisioning scheme is deployed to two types of objects.
- [meta node](arch/# meta node) (Meta): deployment infrastructure to perform control logic, each Pigsty deployment requires at least one meta node, which can be reused as a normal node.
- [Database Node](arch/#Database Node) (Node): used to deploy database clusters/instances, Pigsty uses exclusive deployment with one-to-one correspondence between nodes and database instances.
The relevant concepts of Pigsty provisioning solution are as follows.
1 - Naming Rules
Introduction to pigsty naming rules
You can refer to those you can name. You can take action on those you can refer
Concepts and their naming are very important things, and the naming style reflects the engineer’s knowledge of the system architecture. Ill-defined concepts will lead to confusion in communication, and arbitrarily set names will create unexpected additional burden. Therefore it needs to be designed judiciously. This article introduces the relevant entities in Pigsty and the principles followed for their naming.
Conclusion
In Pigsty, the core four types of entities are: Cluster, Service, Instance, Node
- Cluster is the basic autonomous unit, which is assigned **uniquely by the user to express the business meaning and serve as the top-level namespace.
- Clusters contain a series of Nodes at the hardware level, i.e., physical machines, virtual machines (or Pods) that can be uniquely identified by IP.
- The cluster contains a series of Instance at the software level, i.e., software servers, which can be uniquely identified by IP:Port.
- The cluster contains a series of Services at the service level, i.e., accessible domains and endpoints that can be uniquely identified by domains.
- Cluster naming can use any name that satisfies the DNS domain name specification, not with a dot (
[a-zA-Z0-9-]+).
- Node naming uses the cluster name as a prefix, followed by
- and then an integer ordinal number (recommended to be assigned starting from 0, consistent with k8s)
- Because Pigsty uses exclusive deployment, nodes correspond to instances one by one. Then the instance naming can be consistent with the node naming, i.e.
${cluster}-${seq} way.
- Service naming also uses the cluster name as the prefix, followed by
- to connect the service specifics, such as primary, replica, offline, delayed, etc.
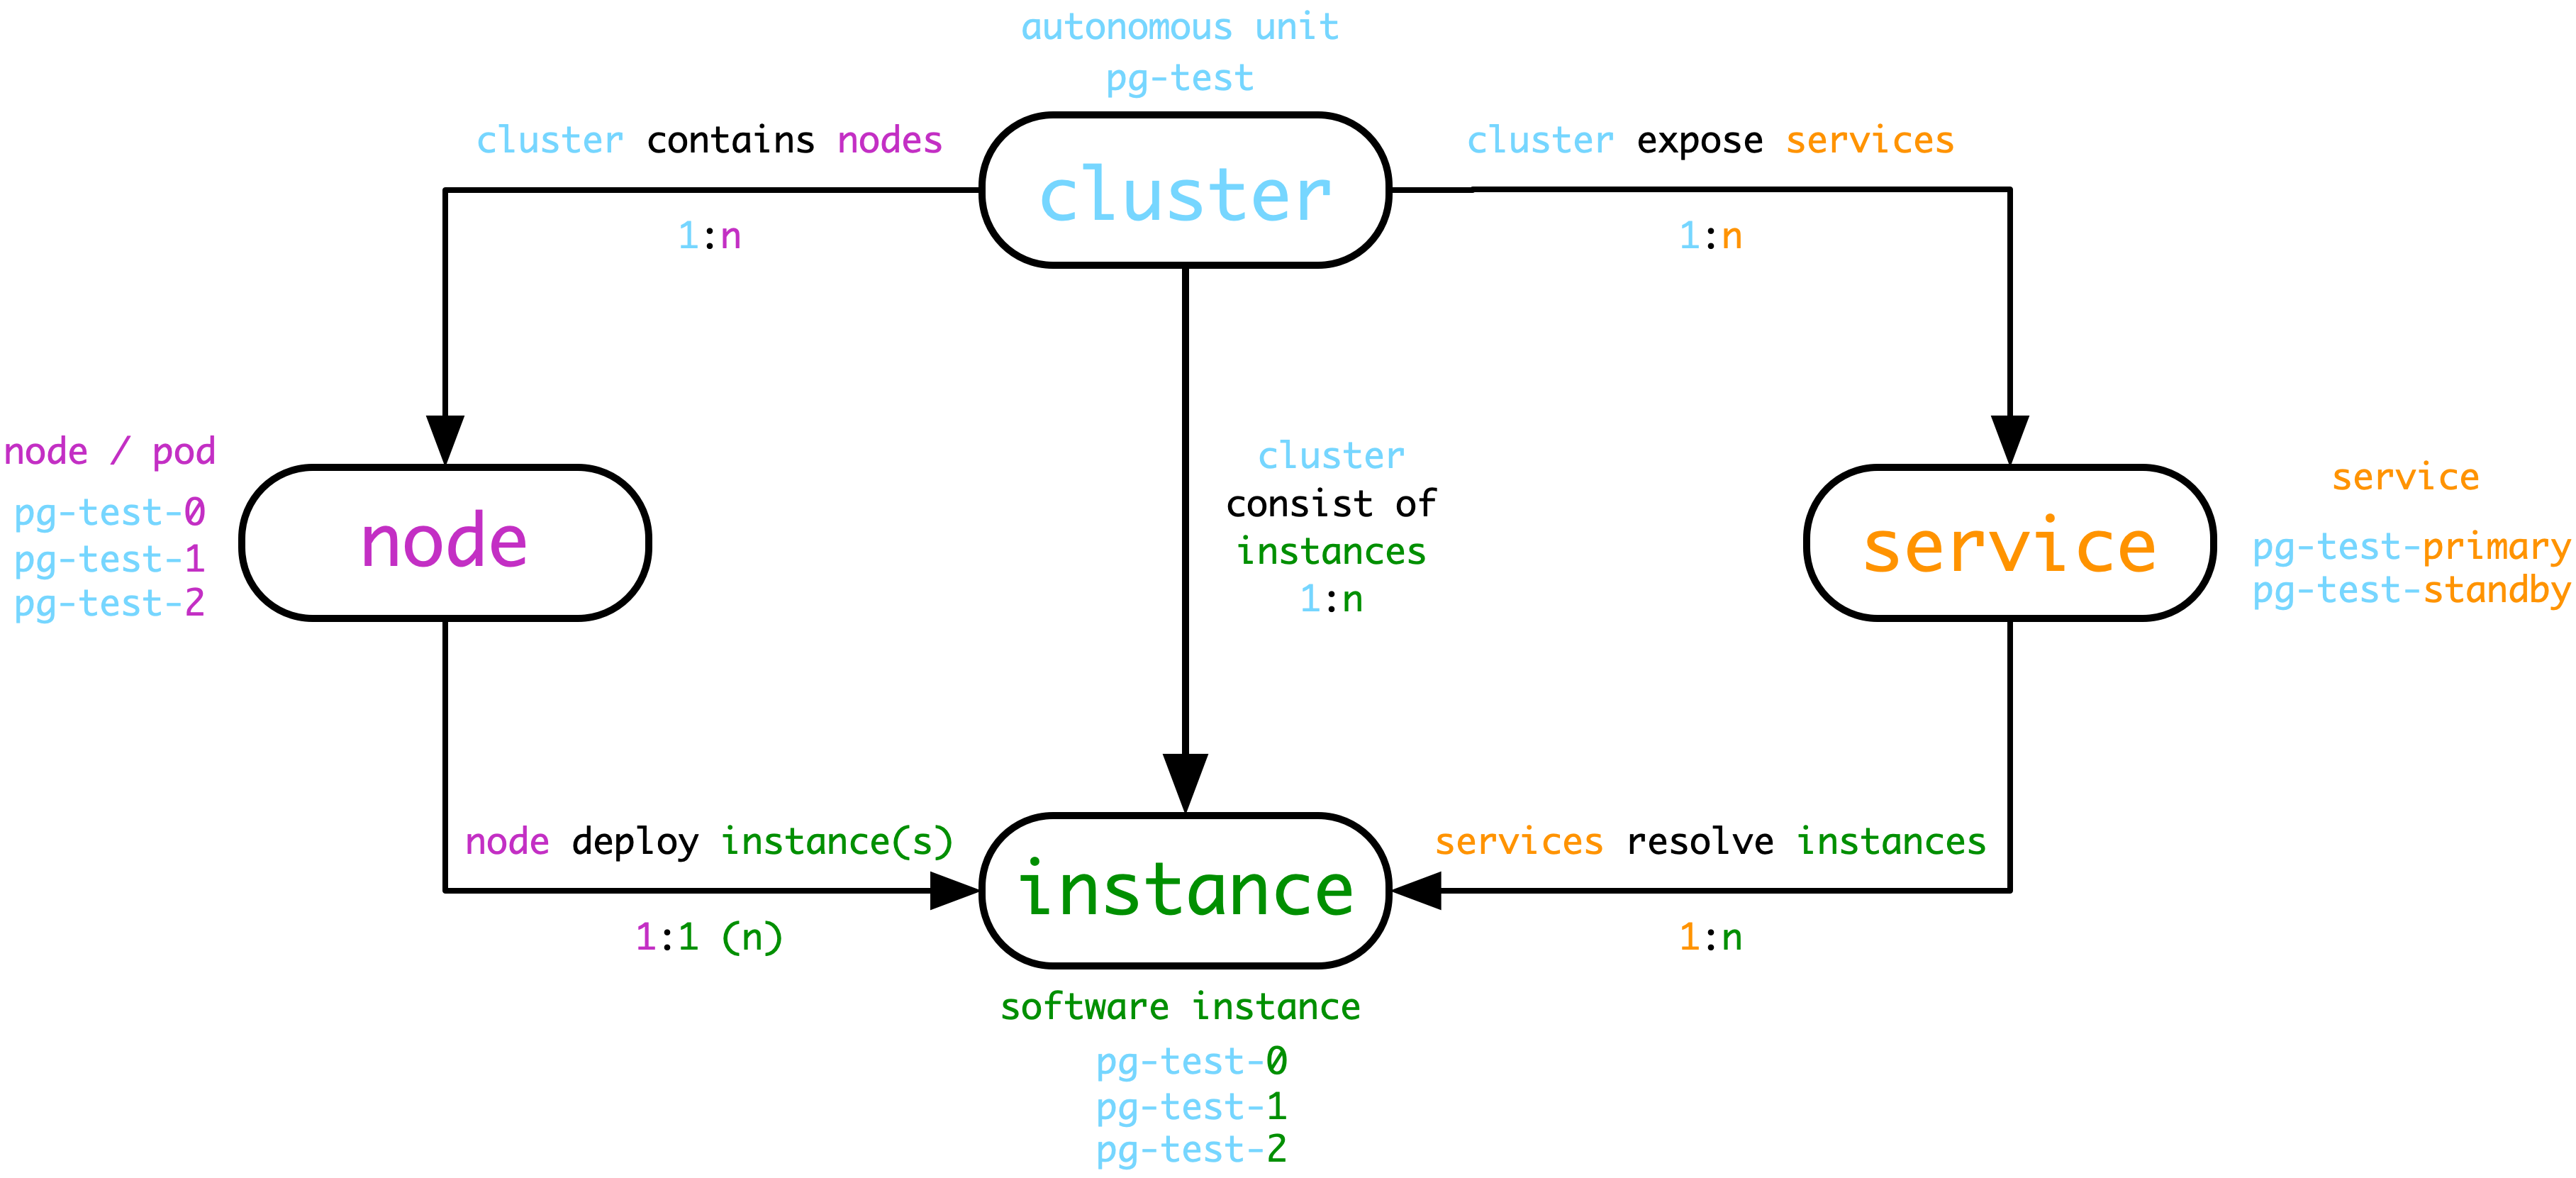
In the above figure, for example, the database cluster used for testing is named ``pg-test'', which consists of three database server instances, one master and two slaves, deployed on the three nodes belonging to the cluster. The pg-testcluster cluster provides two services to the outside world, the read-write servicepg-test-primaryand the read-only copy servicepg-test-replica`.
Entities
In Postgres cluster management, there are the following entity concepts.
Cluster (Cluster)
A cluster is the basic autonomous business unit, which means that the cluster can be organized as a whole to provide services to the outside world. Similar to the concept of Deployment in k8s. Note that Cluster here is a software level concept, not to be confused with PG Cluster (Database Set Cluster, i.e. a data directory containing multiple PG Databases with a single PG instance) or Node Cluster (Machine Cluster).
A cluster is one of the basic units of management, an organizational unit used to unify various resources. For example, a PG cluster may include.
- Three physical machine nodes
- One master instance, which provides database read and write services to the external world.
- Two slave instances, which provide read-only copies of the database to the public.
- Two externally exposed services: read-write service, read-only copy service.
Each cluster has a unique identifier defined by the user according to the business requirements. In this example, a database cluster named pg-test is defined.
Nodes (Node)
Node is an abstraction of a hardware resource, usually referring to a working machine, either a physical machine (bare metal) or a virtual machine (vm), or a Pod in k8s. note here that Node in k8s is an abstraction of a hardware resource, but in terms of actual management use, it is the Pod in k8s rather than the Node that is more similar to the Node concept here. In short, the key elements of a Node are.
- Node is an abstraction of a hardware resource that can run a range of software services
- Nodes can use IP addresses as unique identifiers
Although the lan_ip address can be used as the node unique identifier, for ease of management, the node should have a human-readable meaning-filled name as the node’s Hostname, as another common node unique identifier.
Service
A service is a named abstraction of a software service (e.g. Postgres, Redis). Services can be implemented in a variety of ways, but their key elements are.
- an addressable and accessible service name for providing access to the outside world, for example.
- A DNS domain name (
pg-test-primary)
- An Nginx/Haproxy Endpoint
- ** Service traffic routing resolution and load balancing mechanism** for deciding which instance is responsible for handling requests, e.g.
- DNS L7: DNS resolution records
- HTTP Proxy: Nginx/Ingress L7: Nginx Upstream configuration
- TCP Proxy: Haproxy L4: Haproxy Backend configuration
- Kubernetes: Ingress: Pod Selector Selector.
The same dataset cluster usually includes a master and a slave, both of which provide read and write services (primary) and read-only copy services (replica), respectively.
Instance
An instance refers to a specific database server**, which can be a single process, a group of processes sharing a common fate, or several closely related containers within a Pod. The key elements of an instance are.
- Can be uniquely identified by IP:Port
- Has the ability to process requests
For example, we can consider a Postgres process, the exclusive Pgbouncer connection pool that serves it, the PgExporter monitoring component, the high availability component, and the management Agent as a whole that provides services as a single database instance.
Instances are part of a cluster, and each instance has its own unique identifier to distinguish it within the cluster.
The instances are resolved by the Service, which provides the ability to be addressed, and the Service resolves the request traffic to a specific set of instances.
Naming Rules
An object can have many groups of Tags and Metadata/Annotation, but can usually have only one Name.
Managing databases and software is similar to managing pets in that it takes care of them. And naming is one of those very important tasks. Unbridled names (e.g. XÆA-12, NULL, Shi Zhenxiang) are likely to introduce unnecessary hassles (extra complexity), while properly designed names may have unexpected and surprising effects.
In general, object naming should follow some principles.
-
Simple and straightforward, human readable: the name is for people, so it should be memorable and easy to use.
-
Reflect the function, reflect the characteristics: the name needs to reflect the key features of the object
-
Unique, uniquely identifiable: the name should be unique in the namespace, under its own class, and can uniquely identify addressable.
-
Don’t cram too much extraneous stuff into the name: embedding a lot of important metadata in the name is an attractive idea, but can be very painful to maintain, e.g. counter example: pg:user:profile:10.11.12.13:5432:replica:13.
Cluster naming
The cluster name, in fact, is similar to the role of a namespace. All resources that are part of this cluster use this namespace.
For the form of cluster naming, it is recommended to use naming rules that conform to the DNS standard RFC1034 so as not to bury a hole for subsequent transformation. For example, if you want to move to the cloud one day and find that the name you used before is not supported, you will have to change the name again, which is costly.
I think a better approach would be to adopt a stricter restriction: cluster names should not include dots (dot). Only lowercase letters, numbers, and minus hyphens (hyphen)- should be used. This way, all objects in the cluster can use this name as a prefix for a wide variety of places without worrying about breaking certain constraints. That is, the cluster naming rule is
cluster_name := [a-z][a-z0-9-]*
The reason for emphasizing not to use dots in cluster names is that a naming convention used to be popular, such as com.foo.bar. That is, the hierarchical naming method split by points. Although this naming style is concise and quick, there is a problem that there may be arbitrarily many levels in the name given by the user, and the number is not controllable. Such names can cause trouble if the cluster needs to interact with an external system that has some constraints on naming. One of the most intuitive examples is Pod in K8s, where Pod naming rules do not allow . .
Connotation of cluster naming, -separated two-paragraph, three-paragraph names are recommended, e.g.
<cluster type>-<business>-<business line
For example: pg-test-tt would indicate a test cluster under the tt line of business, type pg. pg-user-fin indicates user service under the fin line of business.
Node naming
The recommended naming convention for nodes is the same as for k8s Pods, i.e.
<cluster_name>-<seq>
Node names are determined during the cluster resource allocation phase, and each node is assigned a serial number ${seq}, a self-incrementing integer starting at 0. This is consistent with the naming rules of StatefulSet in k8s, so it can be managed consistently on and off the cloud.
For example, the cluster pg-test has three nodes, so these three nodes can be named as
pg-test-1, pg-test-2 and pg-test-3.
The nodes are named in such a way that they remain the same throughout the life of the cluster for easy monitoring and management.
Instance naming
For databases, exclusive deployment is usually used, where one instance occupies the entire machine node. pg instances are in one-to-one correspondence with Nodes, so you can simply use the identifier of the Node as the identifier of the Instance. For example, the name of the PG instance on node pg-test-1 is: pg-test-1, and so on.
There is a great advantage in using exclusive deployment, where one node is one instance, which minimizes the management complexity. The need to mix parts usually comes from the pressure of resource utilization, but virtual machines or cloud platforms can effectively solve this problem. With vm or pod abstraction, even each redis (1 core 1G) instance can have an exclusive node environment.
As a convention, node 0 (Pod), in each cluster, will be used as the default primary library. This is because it is the first node allocated at initialization.
Service naming
Generally speaking, the database provides two basic services externally: primary read-write service, and replica read-only copy service.
Then the services can be named using a simple naming rule: ``primary`''
<cluster_name>-<service_name>
For example, here the pg-test cluster contains two services: the read-write service pg-test-primary and the read-only replica service pg-test-replica.
A popular instance/node naming rule: <cluster_name>-<service_role>-<sequence>, where the master-slave identity of the database is embedded in the instance name. This naming convention has both advantages and disadvantages. The advantage is that you can tell at a glance which instance/node is the master and which is the slave when managing it. The disadvantage is that once Failover occurs, the names of instances and nodes must be adjusted to maintain persistence, which creates additional maintenance work. In addition, service and node instances are relatively independent concepts, and this Embedding nomenclature distorts this relationship by uniquely affiliating instances to services. However, this assumption may not be satisfied in complex scenarios. For example, a cluster may have several different ways of dividing services, and there is likely to be overlap between the different divisions.
- Readable slave (resolves to all instances including the master)
- Synchronous slave (resolves to a backup library that uses synchronous commits)
- Deferred slave, backup instances (resolves to a specific specific instance)
So instead of embedding the service role in the instance name, maintain a list of target instances in the service. After all, names are not all-powerful, so don’t embed too much non-essential information into the object names.
2 - Architecture
Introduction to Pigsty Architecture
A Pigsty deployment is architecturally divided into two parts.
- Infrastructure : deployed on meta nodes, monitoring, DNS, NTP, DCS, Yum sources, etc. basic services.
- [Database Cluster](#Database Cluster) (PgSQL) : Deployed on database nodes to provide database services to the outside world as a cluster.
Also, the nodes (physical machines, virtual machines, Pods) used for deployment are divided into two types.
- Metanode (Meta): deploying infrastructure, executing control logic, at least one metanode is required for each Pigsty deployment.
- [Database Node](#Database Node) (Node): used to deploy database clusters/instances, nodes correspond to database instances one by one.

Sample sandbox
Using the four-node sandbox environment that comes with Pigsty as an example, the distribution of components on the nodes is shown in the following figure.
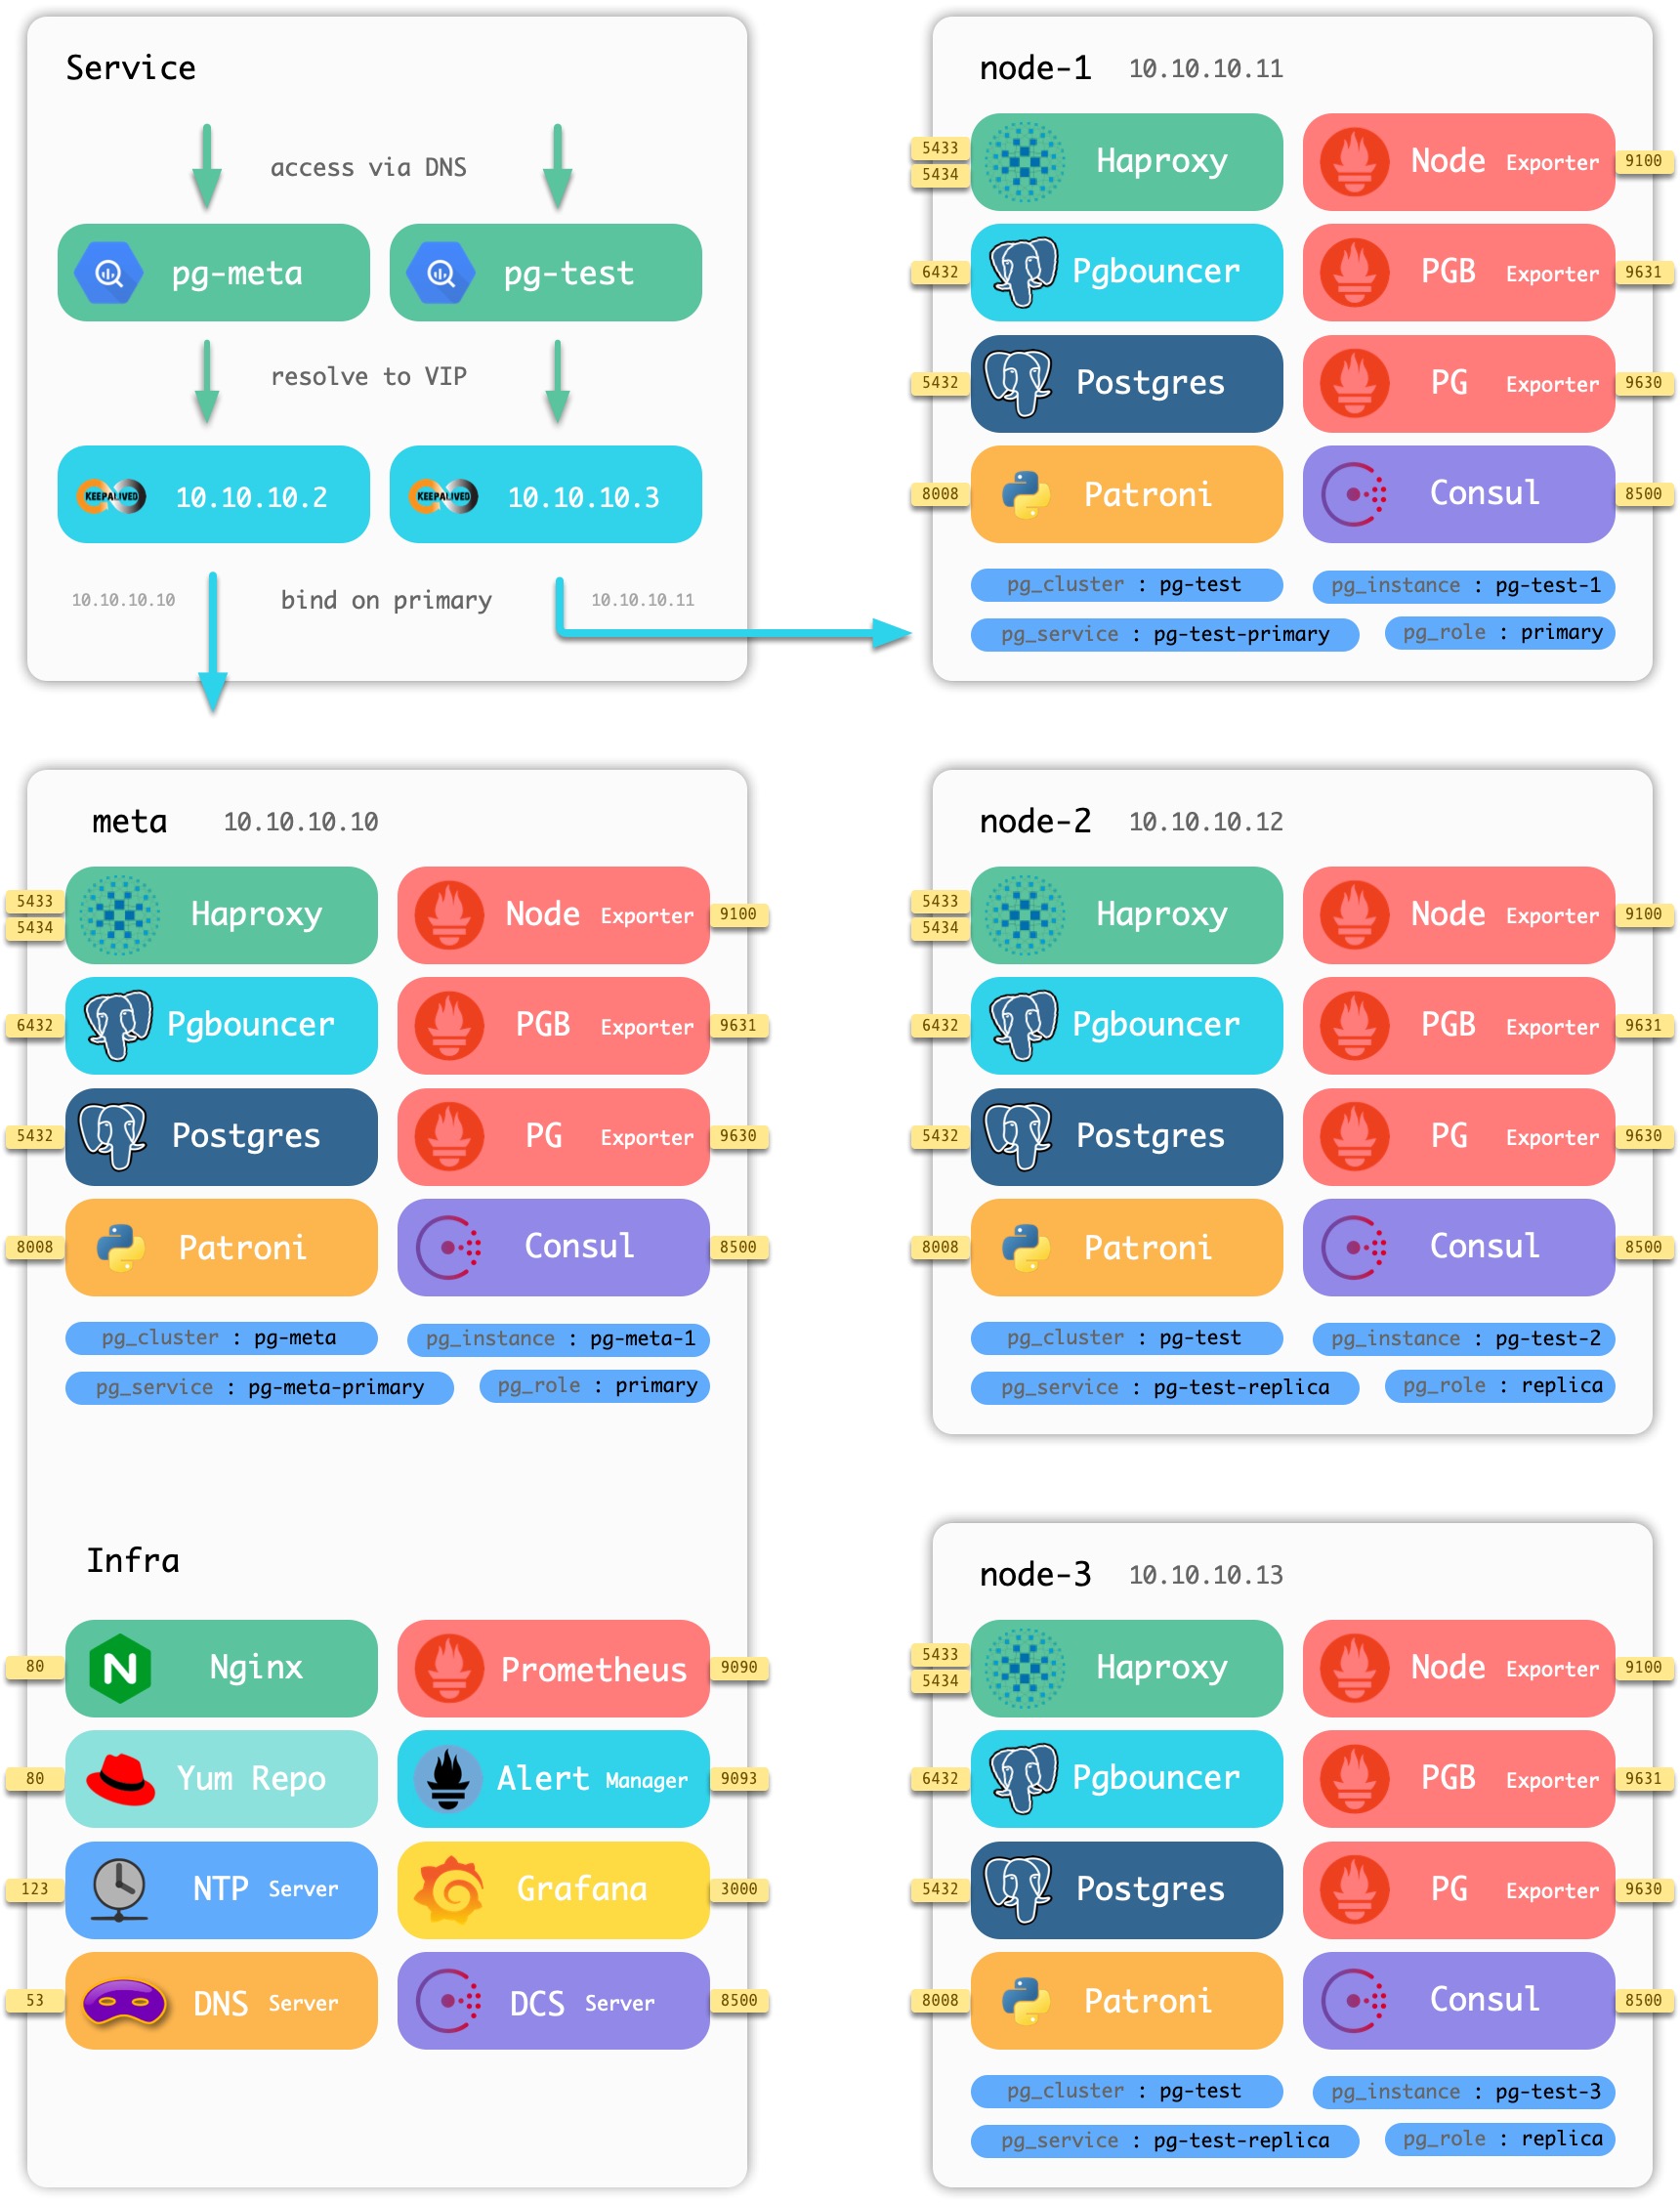
Figure : Nodes and components contained in the Pigsty sandbox
The sandbox consists of a [meta node](#meta node) and four [database nodes](#database nodes) (the meta node is also reused as a database node), deployed with one set of infrastructure and two sets of [database clusters](#database clusters). meta is a meta-node, deployed with infrastructure components, also multiplexed as a common database node, deployed with a single master database cluster pg-meta. node-1, node-2, node-3 are normal database nodes, deployed with database cluster pg-test.
Infrastructure
Each set of Pigsty [deployment](. /… /deploy/) (Deployment) requires some infrastructure to make the whole system work properly.
Infrastructure is usually handled by a professional Ops team or cloud vendor, but Pigsty, as an out-of-the-box product solution, integrates the basic infrastructure into the provisioning solution.
- Domain infrastructure: Dnsmasq (some requests are forwarded to Consul DNS for processing)
- Time infrastructure: NTP
- Monitoring infrastructure: Prometheus
- Alarm infrastructure: Altermanager
- Visualization infrastructure: Grafana
- Local source infrastructure: Yum/Nginx
- Distributed Configuration Storage: etcd/consul
- Pigsty infrastructure: MetaDB meta-database, management component Ansible, timed tasks, with other advanced feature components.
The infrastructure is deployed on meta nodes. A set of environments containing one or more meta-nodes for infrastructure deployment.
All infrastructure components are deployed replica-style except for Distributed Configuration Store (DCS); if there are multiple meta-nodes, the DCS (etcd/consul) on the meta-nodes act together as the DCS Server.
In each environment, Pigsty at a minimum requires a meta-node that will act as the control center for the entire environment. The meta-node is responsible for various administrative tasks: saving state, managing configuration, initiating tasks, collecting metrics, and so on. The infrastructure components of the entire environment, Nginx, Grafana, Prometheus, Alertmanager, NTP, DNS Nameserver, and DCS, will be deployed on the meta node.
The meta node will also be used to deploy the meta database (Consul or Etcd), and users can also use existing external DCS clusters. If deploying DCS to a meta-node, it is recommended that 3 meta-nodes be used in a production environment to fully guarantee the availability of DCS services. infrastructure components outside of DCS will be deployed as peer-to-peer copies on all meta-nodes. The number of meta-nodes requires a minimum of 1, recommends 3, and recommends no more than 5.
The services running on the meta-nodes are shown below.
| component |
port |
default domain |
description |
| Grafana |
3000 |
g.pigsty |
Pigsty Monitoring System GUI |
| Prometheus |
9090 |
p.pigsty |
Monitoring Timing Database |
| AlertManager |
9093 |
a.pigsty |
Alarm aggregation management component |
| Consul |
8500 |
c.pigsty |
Distributed Configuration Management, Service Discovery |
| Consul DNS |
8600 |
- |
Consul-provided DNS services |
| Nginx |
80 |
pigsty |
Entry proxy for all services |
| Yum Repo |
80 |
yum.pigsty |
Local Yum sources |
| Haproxy Index |
80 |
h.pigsty |
Access proxy for all Haproxy management interfaces |
| NTP |
123 |
n.pigsty |
The NTP time server used uniformly by the environment |
| Dnsmasq |
53 |
- |
The DNS name resolution server used by the environment |
The base setup architecture deployed on the meta-node is shown in the following figure.
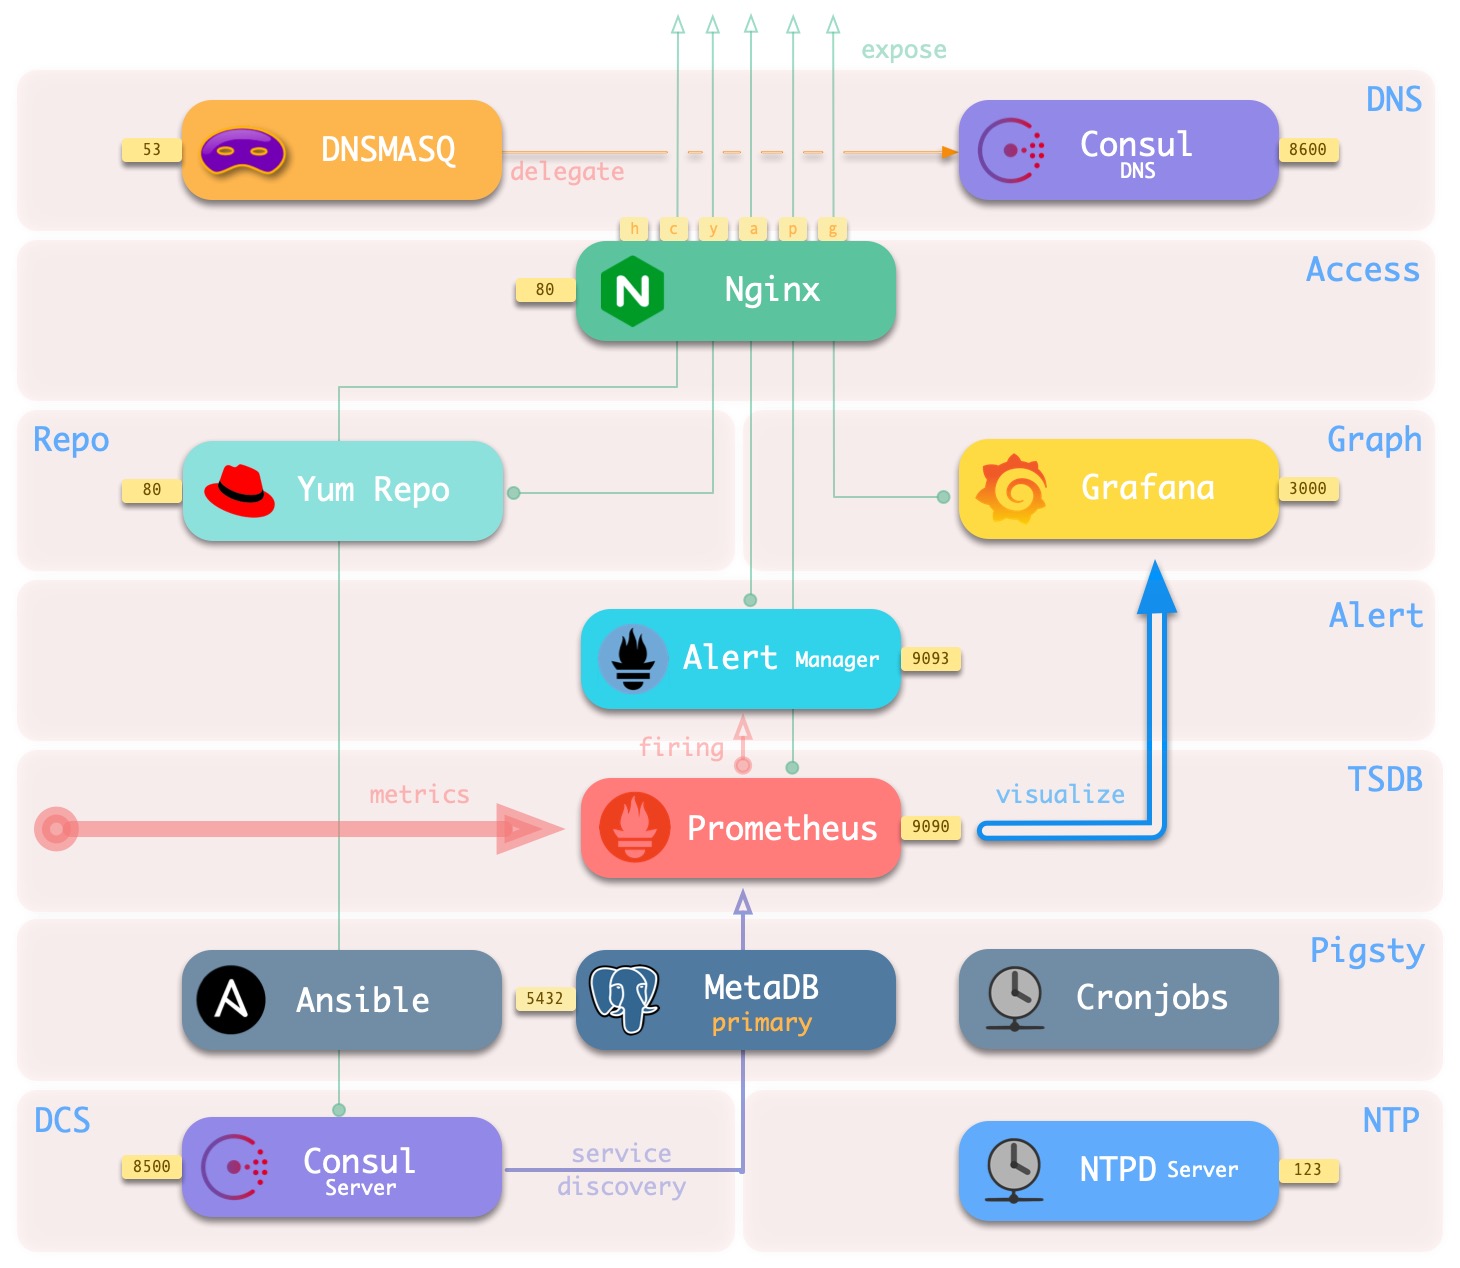
The main interactions are as follows.
-
Dnsmasq provides DNS resolution services within the environment (optional, can use existing Nameserver)
Some DNS resolution will ** be forwarded ** by Consul DNS
-
Nginx externally exposes all web services and forwards them differently by domain name.
-
Yum Repo is the default server for Nginx, providing the ability to install software from offline for all nodes in the environment.
-
Grafana is the carrier for the Pigsty monitoring system, used to visualize data in Prometheus and CMDB.
-
Prometheus is the timing database for monitoring.
- Prometheus fetches all Exporter to be crawled from Consul by default and associates identity information for them.
- Prometheus pulls monitoring metrics data from the Exporter, precomputes and processes it and stores it in its own TSDB.
- Prometheus calculates alarm rules and sends the alarm events to Alertmanager for processing.
-
Consul Server is used to save the status of DCS, reach consensus, and serve metadata queries.
-
NTP Service is used to synchronize the time of all nodes in the environment (external NTP service is optional)
-
Pigsty related components.
- Ansible for executing scripts, initiating control
- MetaDB for supporting various advanced features (also a standard database cluster)
- Timed task controller (backup, cleanup, statistics, patrol, advanced features not yet added)
Postgres clusters
Databases in production environments are organized in clusters, which clusters are a logical entity consisting of a set of database instances associated by master-slave replication. Each database cluster is a self-organizing business service unit consisting of at least one database instance.
Clusters are the basic business service units, and the following diagram shows the replication topology in a sandbox environment. Where pg-meta-1 alone constitutes a database cluster pg-meta, while pg-test-1, pg-test-2, and pg-test-3 together constitute another logical cluster pg-test.
pg-meta-1
(primary)

pg-test-1 -------------> pg-test-2
(primary) | (replica)
               |pg-test-2
               ^ -------> pg-test-3
                         (replica)
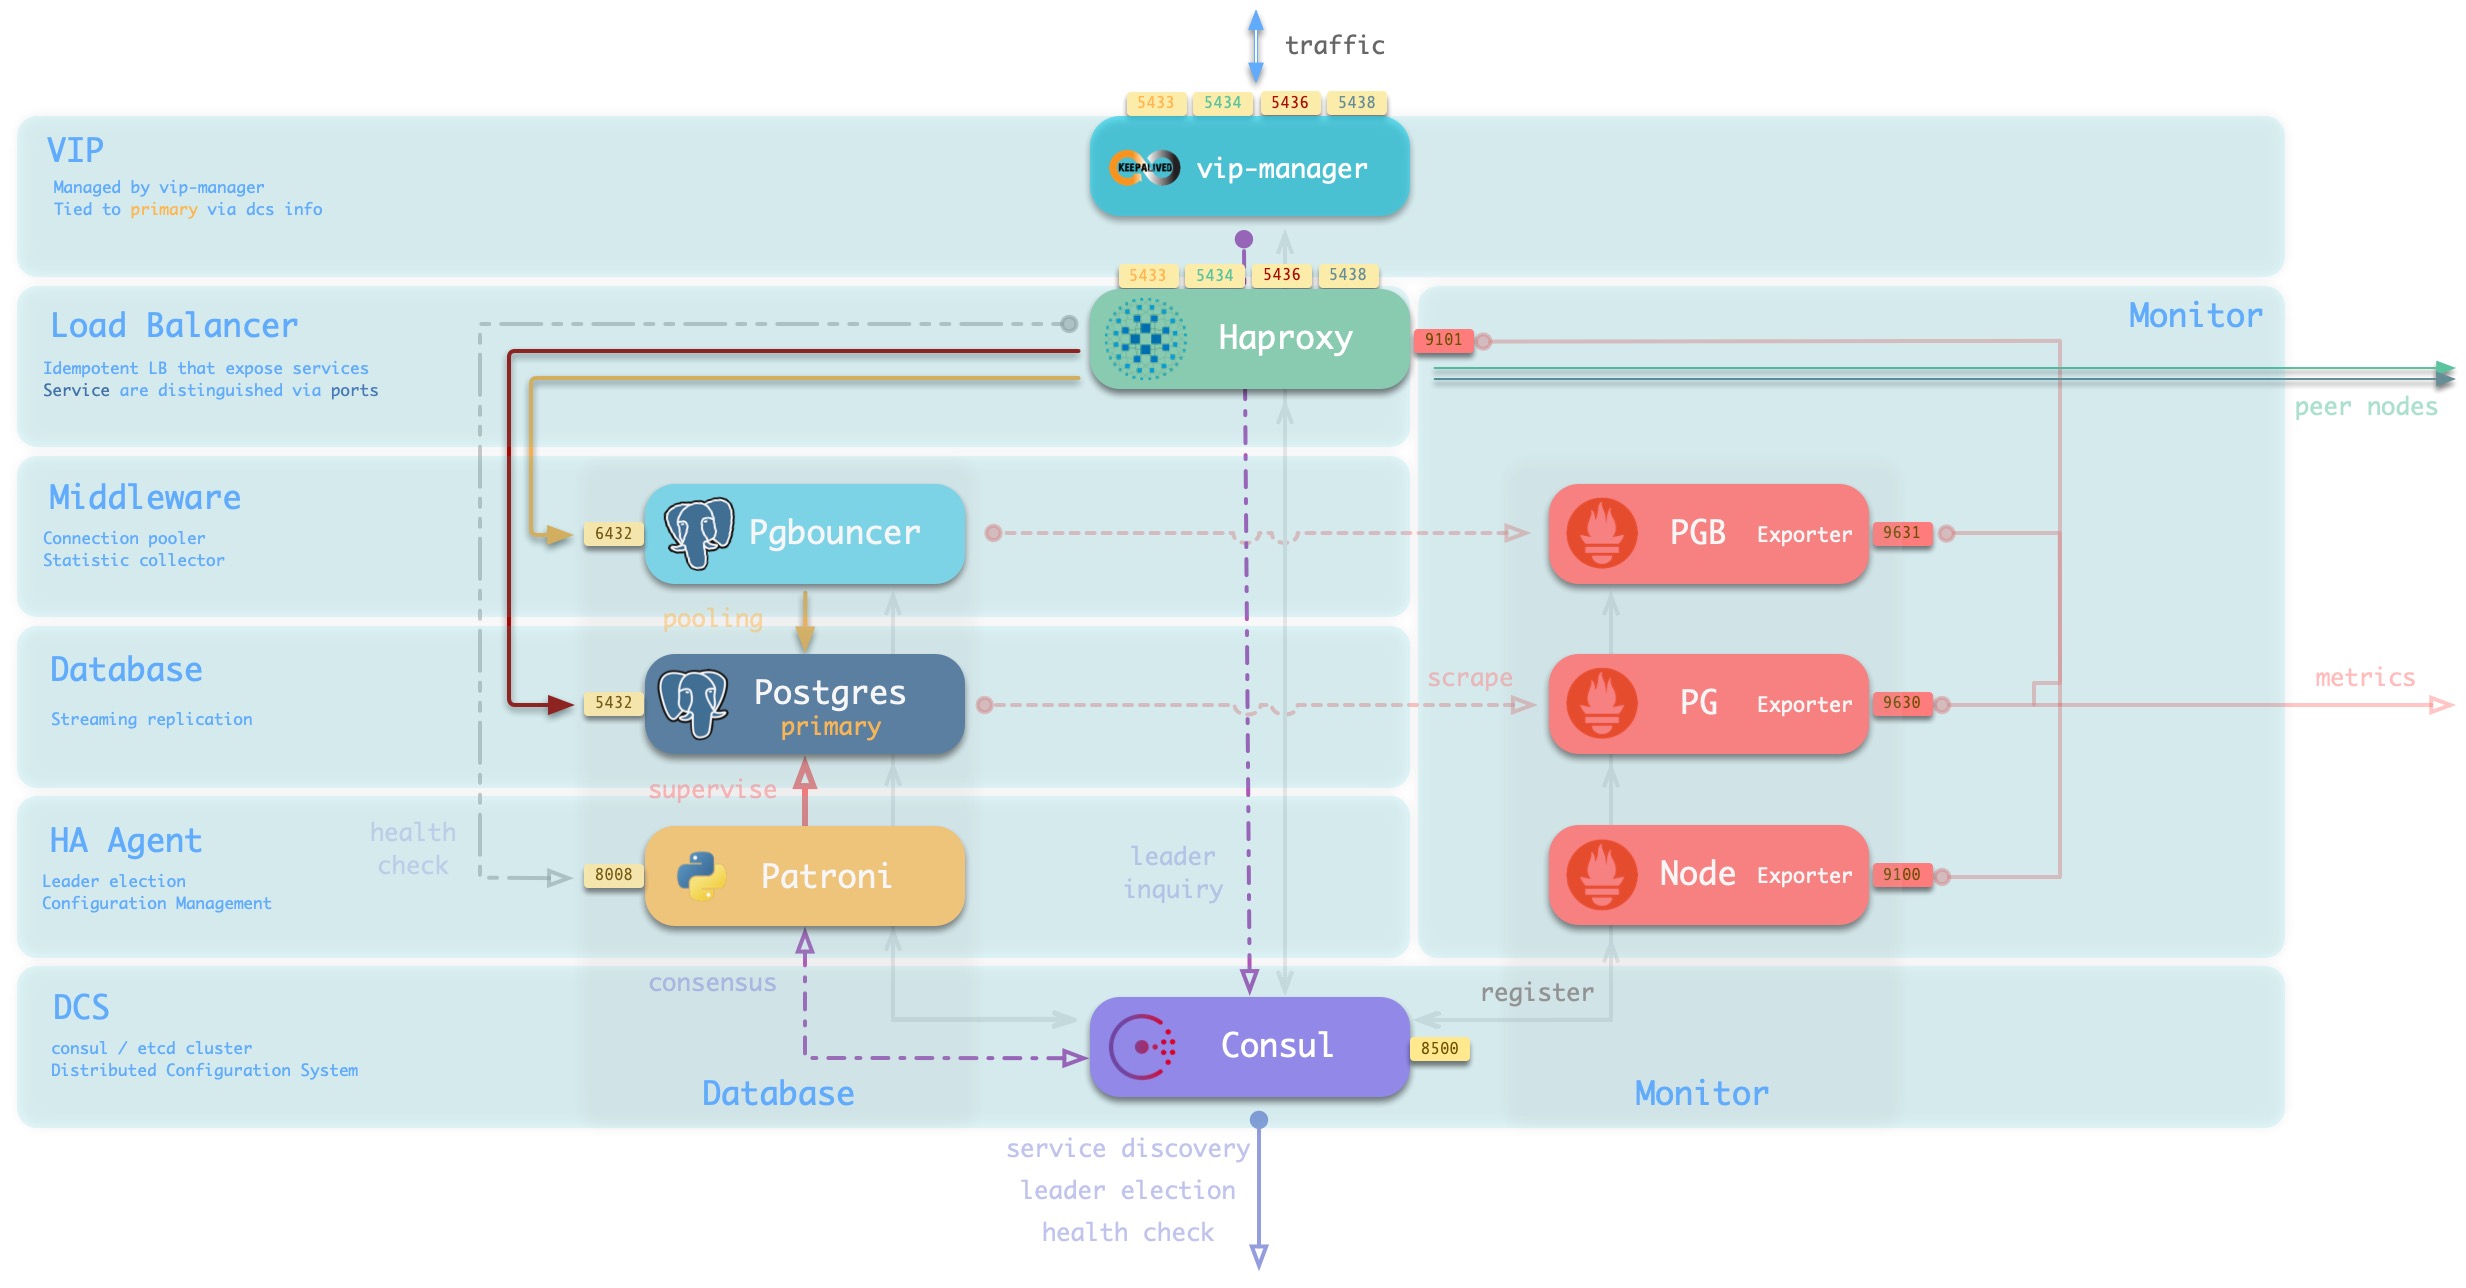
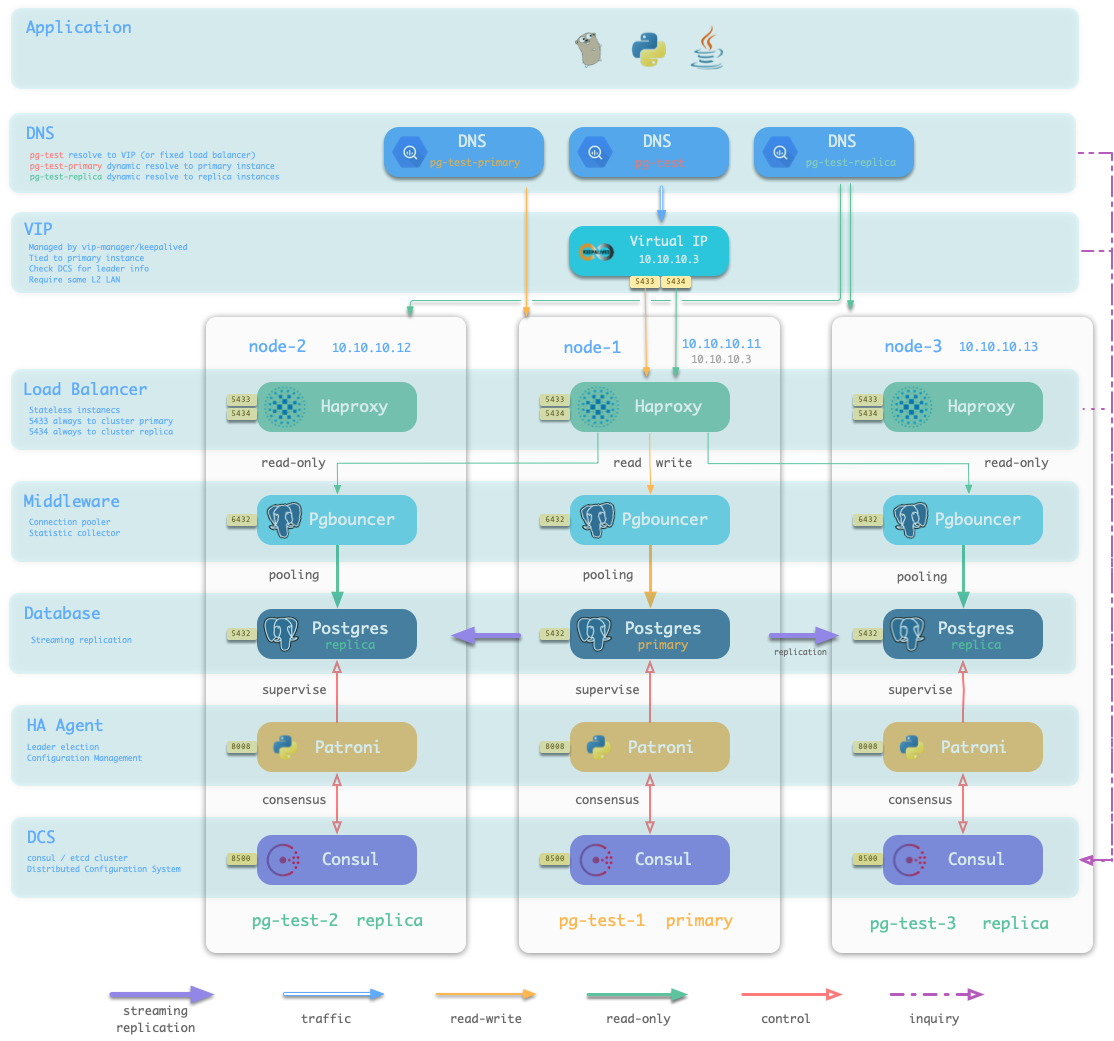
The following figure rearranges the location of related components in the pg-test cluster from the perspective of the database cluster.
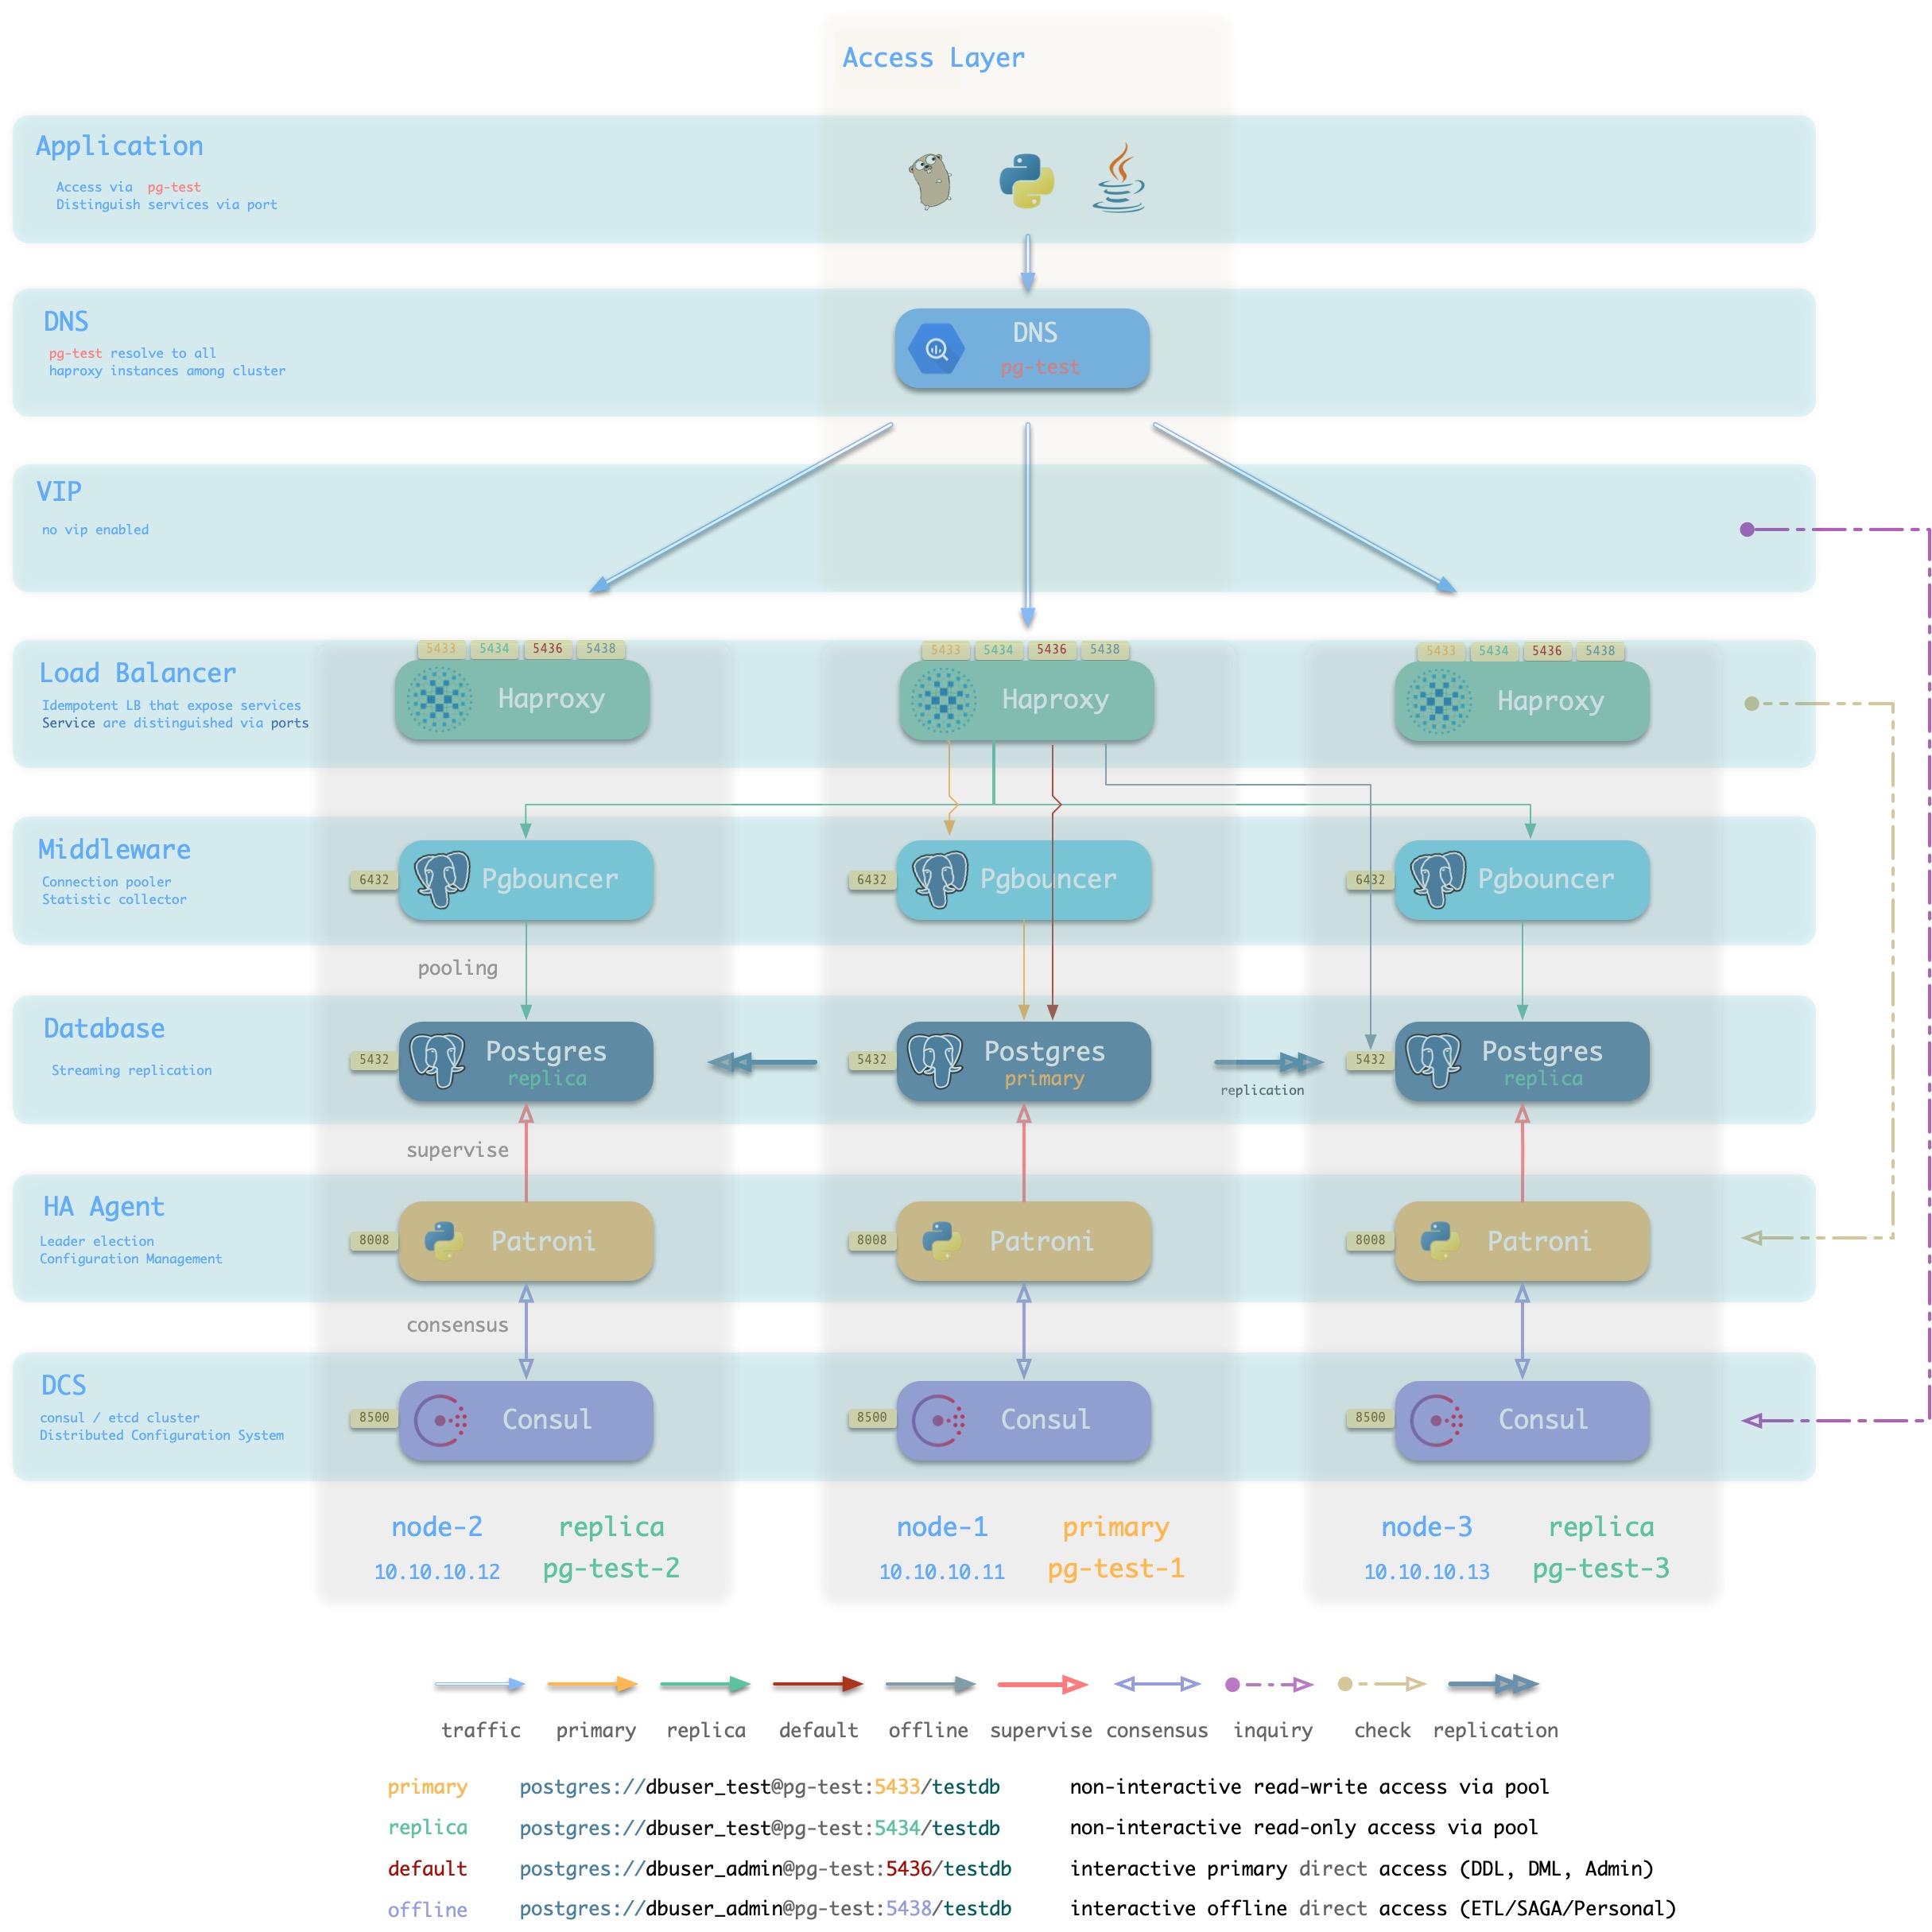
Figure : Looking at the architecture from the logical view of a database cluster ([standard access scenario](. /provision/access/#dns–haproxy))
Pigsty is a database provisioning solution that creates highly available database clusters on demand. Pigsty can automatically failover with business-side read-only traffic unaffected; the impact of read and write traffic is usually in the range of a few seconds to tens of seconds, depending on the specific configuration and load.
In Pigsty, each “database instance” is idempotent in use and is exposed to the public in a similar way to NodePort [database service](… /provision/service/). By default, access to port 5433 of any instance is sufficient to access the master database, and access to port 5434 of any instance is sufficient to access the slave database. Users also have the flexibility to use different ways to access the database at the same time, for details, please refer to: [Database Access](. /provision/access).
Database Nodes
A database node is responsible for running database instances. In Pigsty database instances are fixed using exclusive deployment, where there is one and only one database instance on a node, so nodes and database instances can be uniquely identified with each other (IP address and instance name).
A typical service running on a database node is shown below.
| component |
port |
description |
| Postgres |
5432 |
Postgres Database Service |
| Pgbouncer |
6432 |
Pgbouncer Connection Pooling Service |
| Patroni |
8008 |
Patroni High Availability Components |
| Consul |
8500 |
Distributed Configuration Management, Local Agent for Service Discovery Component Consul |
| Haproxy Primary |
5433 |
Cluster read and write service (primary connection pool) agent |
| Haproxy Replica |
5434 |
Cluster Read-Only Service (Slave Connection Pool) Agent |
| Haproxy Default |
5436 |
Cluster Master Direct Connect Service (for management, DDL/DML changes) |
| Haproxy Offline |
5438 |
Cluster Offline Read Service (directly connected offline instances, for ETL, interactive queries) |
| Haproxy <Service> |
543x |
Additional custom services provided by the cluster will be assigned ports in turn |
| Haproxy Admin |
9101 |
Haproxy Monitoring Metrics and Administration Page |
| PG Exporter |
9630 |
Postgres Monitoring Metrics Exporter |
| PGBouncer Exporter |
9631 |
Pgbouncer Monitoring Metrics Exporter |
| Node Exporter |
9100 |
Machine Node Monitoring Metrics Exporter |
| Consul DNS |
8600 |
DNS Services Provided by Consul |
| vip-manager |
x |
Bind VIPs to the cluster master |
The main interactions are as follows.
-
vip-manager obtains cluster master information via query Consul and binds cluster-specific L2 VIPs to the master node (default access scheme).
-
Haproxy is the database traffic portal for exposing services to the outside world, using different ports (543x) to distinguish between different services.
- Haproxy port 9101 exposes Haproxy’s internal monitoring metrics, while providing an Admin interface to control traffic.
- Haproxy port 5433 points to the cluster master connection pool port 6432 by default
- Haproxy port 5434 points to the cluster slave connection pool port 6432 by default
- Haproxy 5436 port points directly to the cluster master 5432 port by default
- Haproxy 5438 port defaults to point directly to the cluster offline instance port 5432
-
Pgbouncer for pooling database connections, buffering failure shocks, and exposing additional metrics.
-
Production services (high frequency non-interactive, 5433/5434) must be accessed through Pgbouncer.
-
Directly connected services (management and ETL, 5436/5438) must bypass the Pgbouncer direct connection.
-
Postgres provides the actual database service, which constitutes a master-slave database cluster via stream replication.
-
Patroni is used to oversee the Postgres service and is responsible for master-slave election and switchover, health checks, and configuration management.
- Patroni uses Consul to reach consensus as the basis for cluster leader election.
-
Consul Agent is used to issue configurations, accept service registrations, service discovery, and provide DNS queries.
- All process services using the port are registered into Consul
-
PGB Exporter, PG Exporter, Node Exporter are used to ** expose ** database, connection pool, and node monitoring metrics respectively
As an example of an environment consisting of a single [meta-node](# meta-node) and a single [database node](# database node), the architecture is shown in the following figure.
Figure : Single meta-node and single database node (click for larger image)
The interaction between meta nodes and database nodes mainly includes.
-
Database cluster/node’s domain name relies on the meta-node’s Nameserver for resolution.
-
Database node software installation needs to use Yum Repo on the meta node.
-
Database cluster/node monitoring metrics are collected by Prometheus on the meta node.
-
Pigsty will initiate management of the database nodes from the meta node
Perform cluster creation, capacity expansion and contraction, user, service, HBA modification; log collection, garbage cleanup, backup, patrol, etc.
-
Consul of the database node will synchronize locally registered services to the DCS of the meta node and proxy state read and write operations.
-
Database node will synchronize time from meta node (or other NTP server)
3 - Monitoring
Concepts about pigsty monitoring system
3.1 - Hierarchy
Introduction to pigsty monitoring system hierarchy
As in Naming Principle, objects in Pigsty are divided into multiple levels: clusters, services, instances, and nodes.
Monitoring system hierarchy
Pigsty’s monitoring system has more layers. In addition to the two most common layers, Instance and Cluster, there are other layers of organization throughout the system. From the top down, there are 7 levels: **Overview, Slice, Cluster, Service, Instance, Database, Object. **

Figure : Pigsty’s monitoring panel is divided into 7 logical hierarchies and 5 implementation hierarchies
Logical levels
Databases in production environments are often organized in clusters, which are the basic business service units and the most important level of monitoring.
A cluster is a set of database instances associated by master-slave replication, and instance is the most basic level of monitoring.
Whereas multiple database clusters together form a real-world production environment, the Overview level of monitoring provides an overall description of the entire environment.
Multiple database clusters serving the same business in a horizontally split pattern are called Shards, and monitoring at the shard level is useful for locating data distribution, skew, and other issues.
Service is the layer sandwiched between the cluster and the instance, and the service is usually closely associated with resources such as DNS, domain names, VIPs, NodePort, etc.
Database is a sub-instance level object where a database cluster/instance may have multiple databases existing at the same time, and database level monitoring is concerned with activity within a single database.
Object are entities within a database, including tables, indexes, sequence numbers, functions, queries, connection pools, etc. Object-level monitoring focuses on the statistical metrics of these objects, which are closely related to the business.
Hierarchical Streamlining
As a streamlining, just as the OSI 7-layer model for networking was reduced in practice to a five-layer model for TCP/IP, these seven layers were also reduced to five layers bounded by Clusters and Instances: Overview , Clusters , Services , Instance , Databases .
This makes the final hierarchy very concise: all information above the cluster level is the Overview level, all monitoring below the instance level is counted as the Database level, and sandwiched between the Cluster and Instance is the Service level.
Naming Rules
After the hierarchy, the most important issue is naming.
-
there needs to be a way to identify and refer to the components within the different layers of the system.
-
the naming convention should reasonably reflect the hierarchical relationship of the entities in the system
-
the naming scheme should be automatically generated according to the rules, so that it can run maintenance-free and automatically when the cluster is scaled up and down and Failover.
Once we have clarified the hierarchy of the system, we can proceed to name each entity in the system.
For the basic naming rules followed by Pigsty, please refer to Naming Principles section.
Pigsty uses an independent name management mechanism and the naming of entities is self-contained.
If you need to interface with external systems, you can use this naming system directly, or adopt your own naming system by transferring the adaptation.
Cluster Naming
Pigsty’s cluster names are specified by the user and satisfy the regular expression of [a-z0-9][a-z0-9-]*, in the form of pg-test, pg-meta.
node naming
Pigsty’s nodes are subordinate to clusters. pigsty’s node names consist of two parts: [cluster name](#cluster naming) and node number, and are concatenated with -.
The form is ${pg_cluster}-${pg_seq}, e.g. pg-meta-1, pg-test-2.
Formally, node numbers are natural numbers of reasonable length (including 0), unique within the cluster, and each node has its own number.
Instance numbers can be explicitly specified and assigned by the user, usually using an assignment starting from 0 or 1, once assigned, they do not change again for the lifetime of the cluster.
Instance Naming
Pigsty’s instance is subordinate to the cluster and is deployed in an exclusive node style.
Since there is a one-to-one correspondence between instances and nodes, the instance name remains the same as the node life.
Service Naming
Pigsty’s Service is subordinate to the cluster. pigsty’s service name consists of two parts: [cluster name](#cluster naming) and Role, and is concatenated with -.
The form is ${pg_cluster}-${pg_role}, e.g. pg-meta-primary, pg-test-replica.
The options available for pg_role include: primary|replica|offline|delayed.
primary is a special role that each cluster must and can only define one instance of pg_role = primary as the primary library.
The other roles are largely user-defined, with replica|offline|delayed being a Pigsty predefined role.
What next?
After delineating the monitoring hierarchy, you need to [assign identity] to the monitoring object (../identity) to be able to manage them.
3.2 - Observability
From raw information to insight
对于系统管理来说,最重要到问题之一就是可观测性(Observability),下图展示了Postgres的可观测性。

原图地址:https://pgstats.dev/
PostgreSQL 提供了丰富的观测接口,包括系统目录,统计视图,辅助函数。 这些都是用户可以观测的信息。这里列出的信息全部为Pigsty所收录。Pigsty通过精心的设计,将晦涩的指标数据,转换成了人类可以轻松理解的洞察。
可观测性
经典的监控模型中,有三类重要信息:
- 指标(Metrics):可累加的,原子性的逻辑计量单元,可在时间段上进行更新与统计汇总。
- 日志(Log):离散事件的记录与描述
- 追踪(Trace):与单次请求绑定的相关元数据

Pigsty重点关注 指标 信息,也会在后续加入对 日志 的采集、处理与展示,但Pigsty不会收集数据库的 追踪 信息。
指标
下面让以一个具体的例子来介绍指标的获取及其加工产物。
pg_stat_statements是Postgres官方提供的统计插件,可以暴露出数据库中执行的每一类查询的详细统计指标。
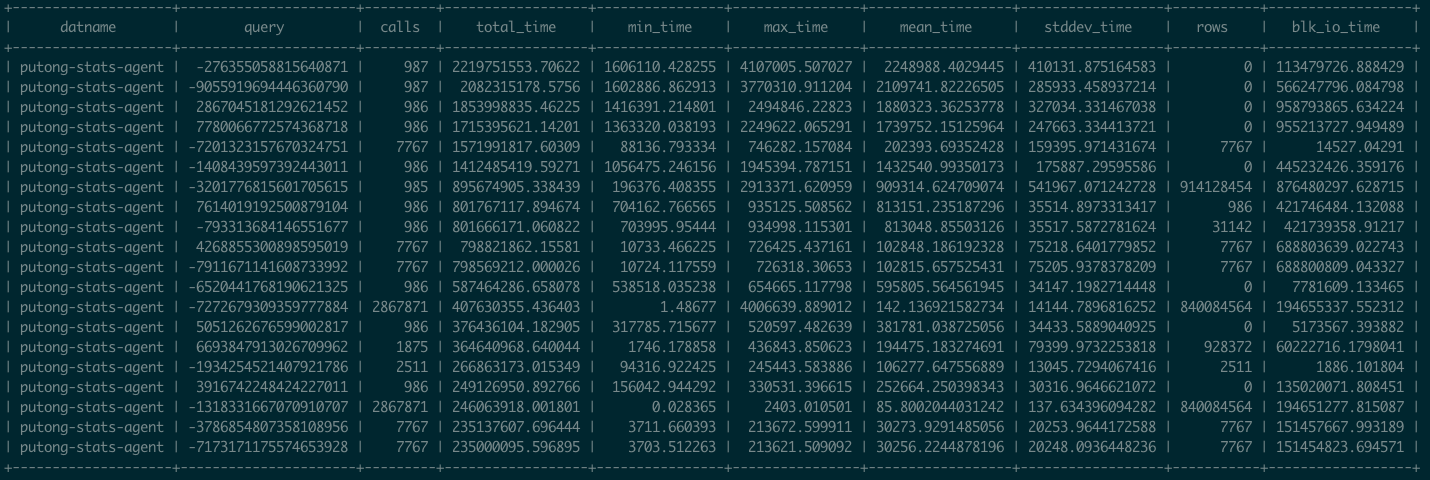
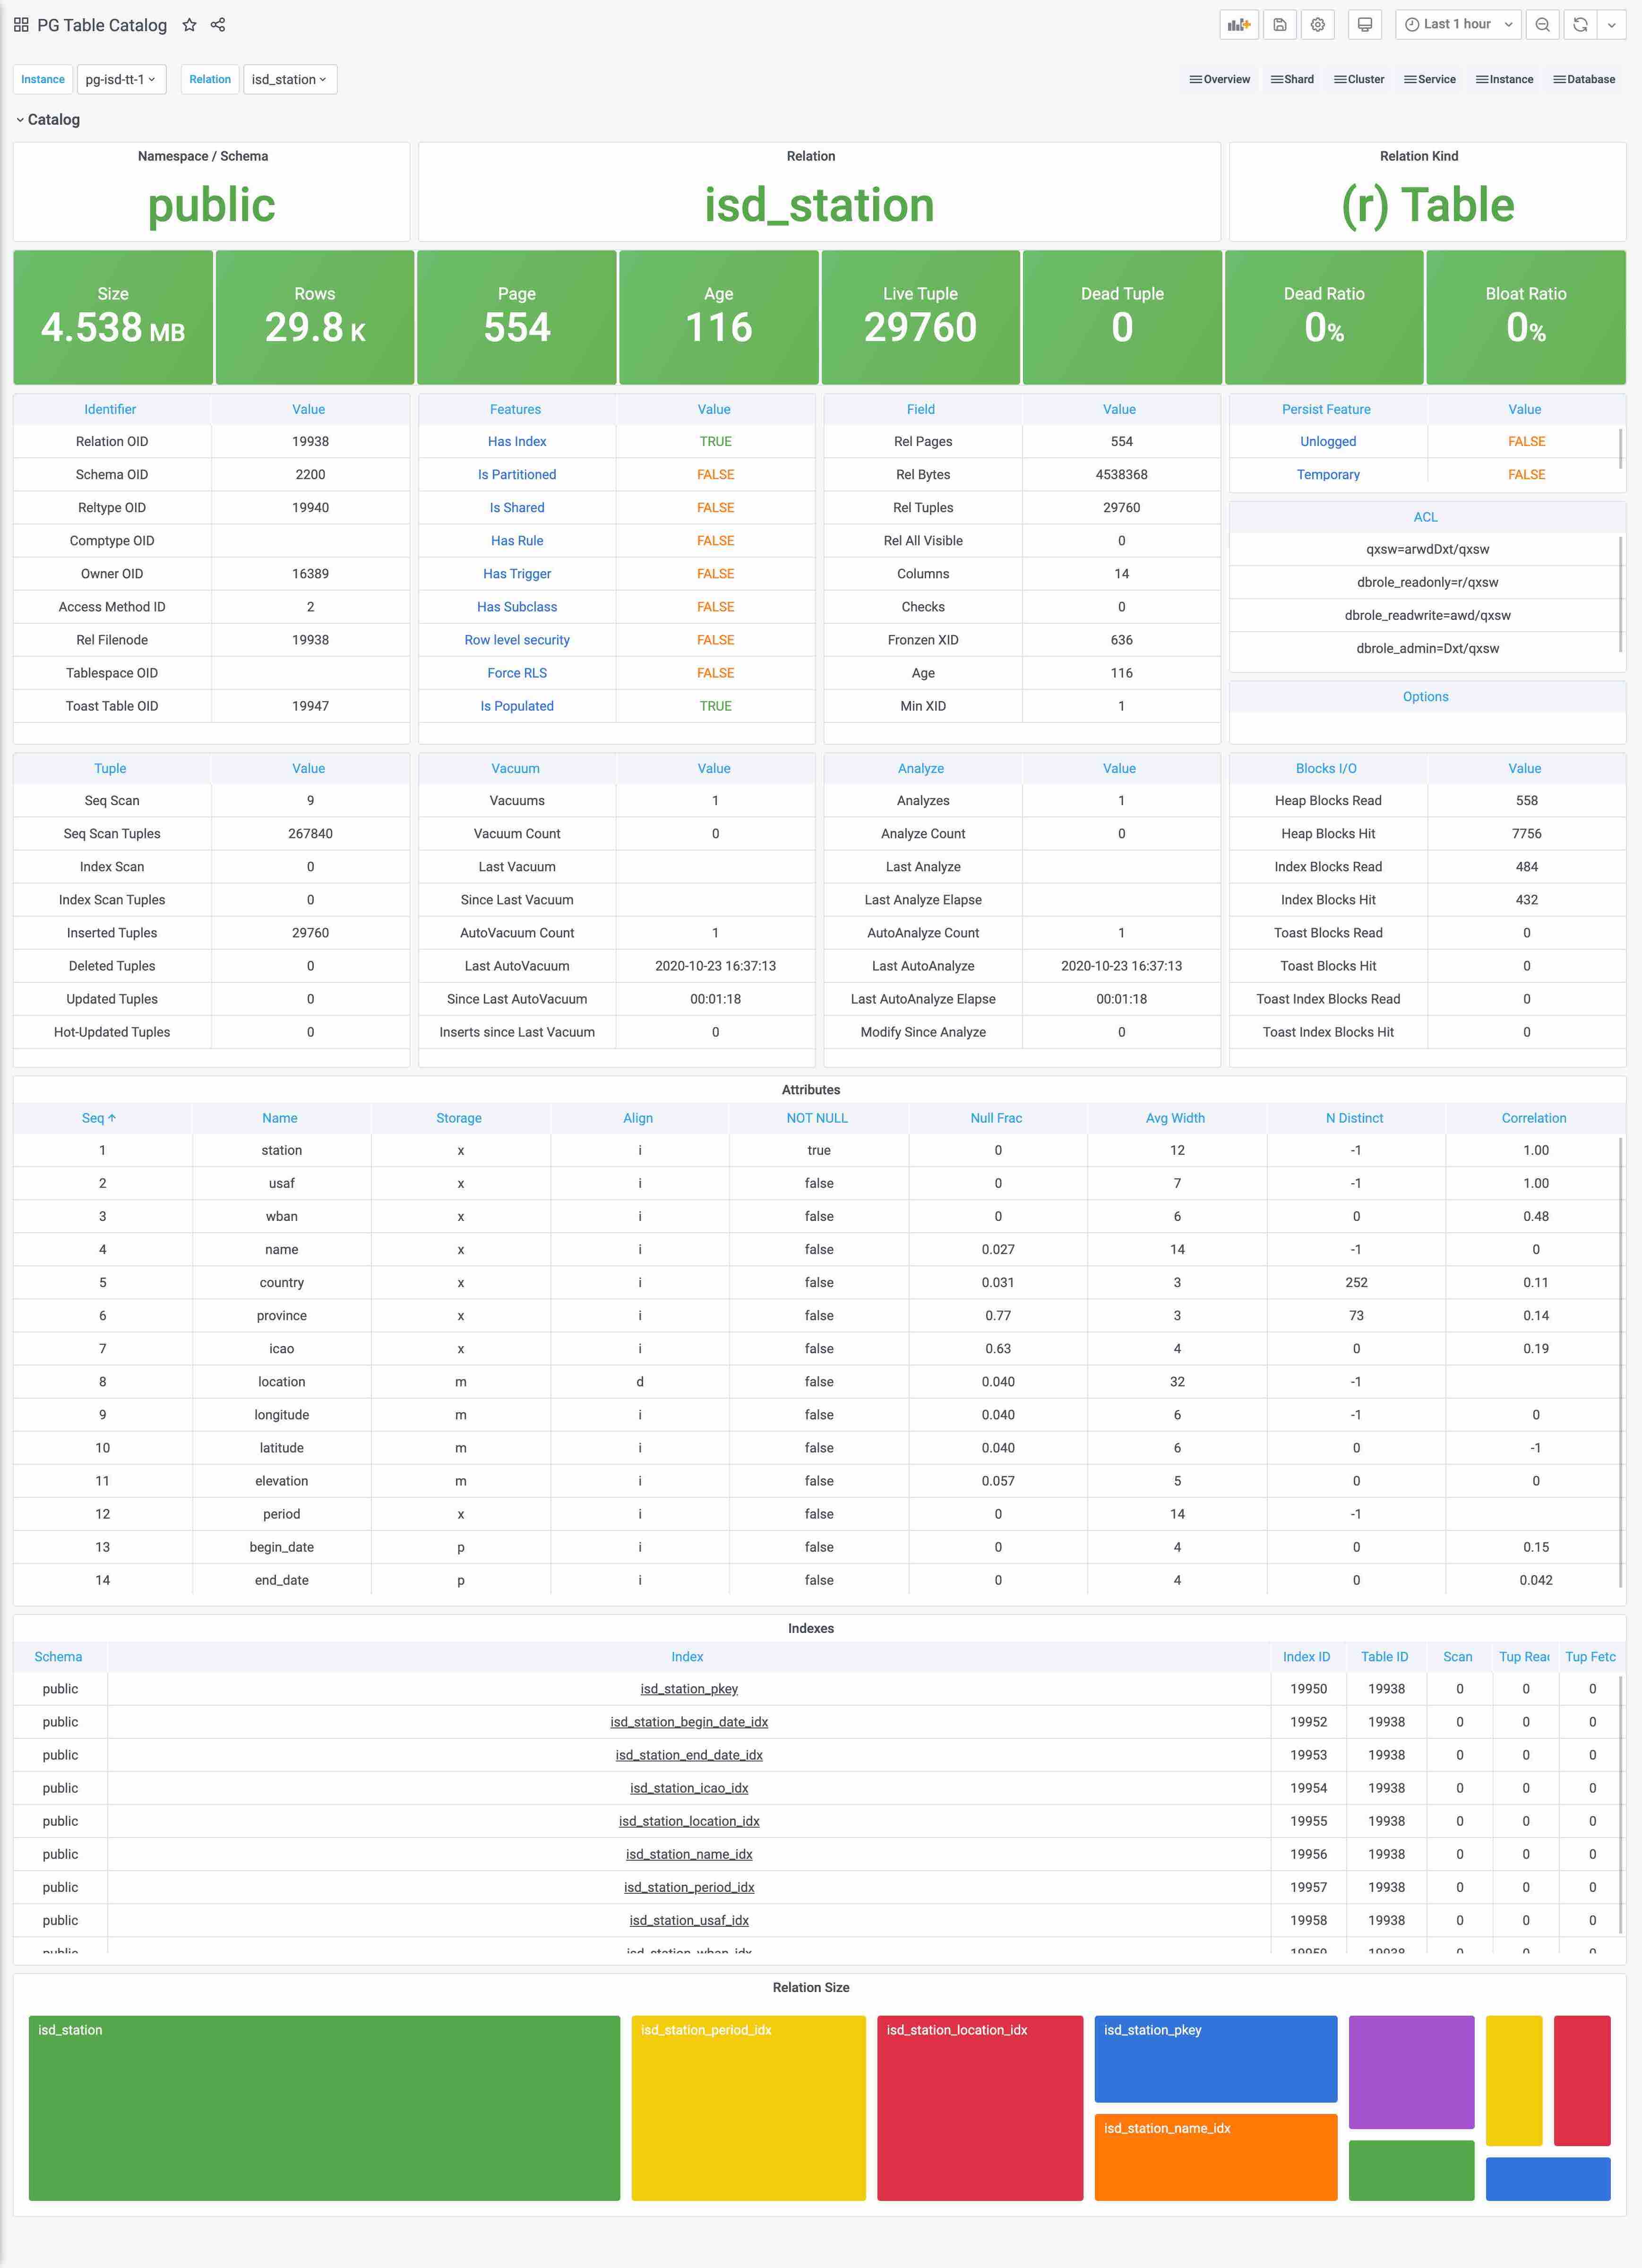
图:pg_stat_statements原始数据视图
这里pg_stat_statements提供的原始指标数据以表格的形式呈现。每一类查询都分配有一个查询ID,紧接着是调用次数,总耗时,最大、最小、平均单次耗时,响应时间都标准差,每次调用平均返回的行数,用于块IO的时间这些指标,(如果是PG13,还有更为细化的计划时间、执行时间、产生的WAL记录数量等新指标)。
这些系统视图与系统信息函数,就是Pigsty中指标数据的原始来源。直接查阅这种数据表很容易让人眼花缭乱,失去焦点。需要将这种指标转换为洞察,也就是以直观图表的方式呈现。
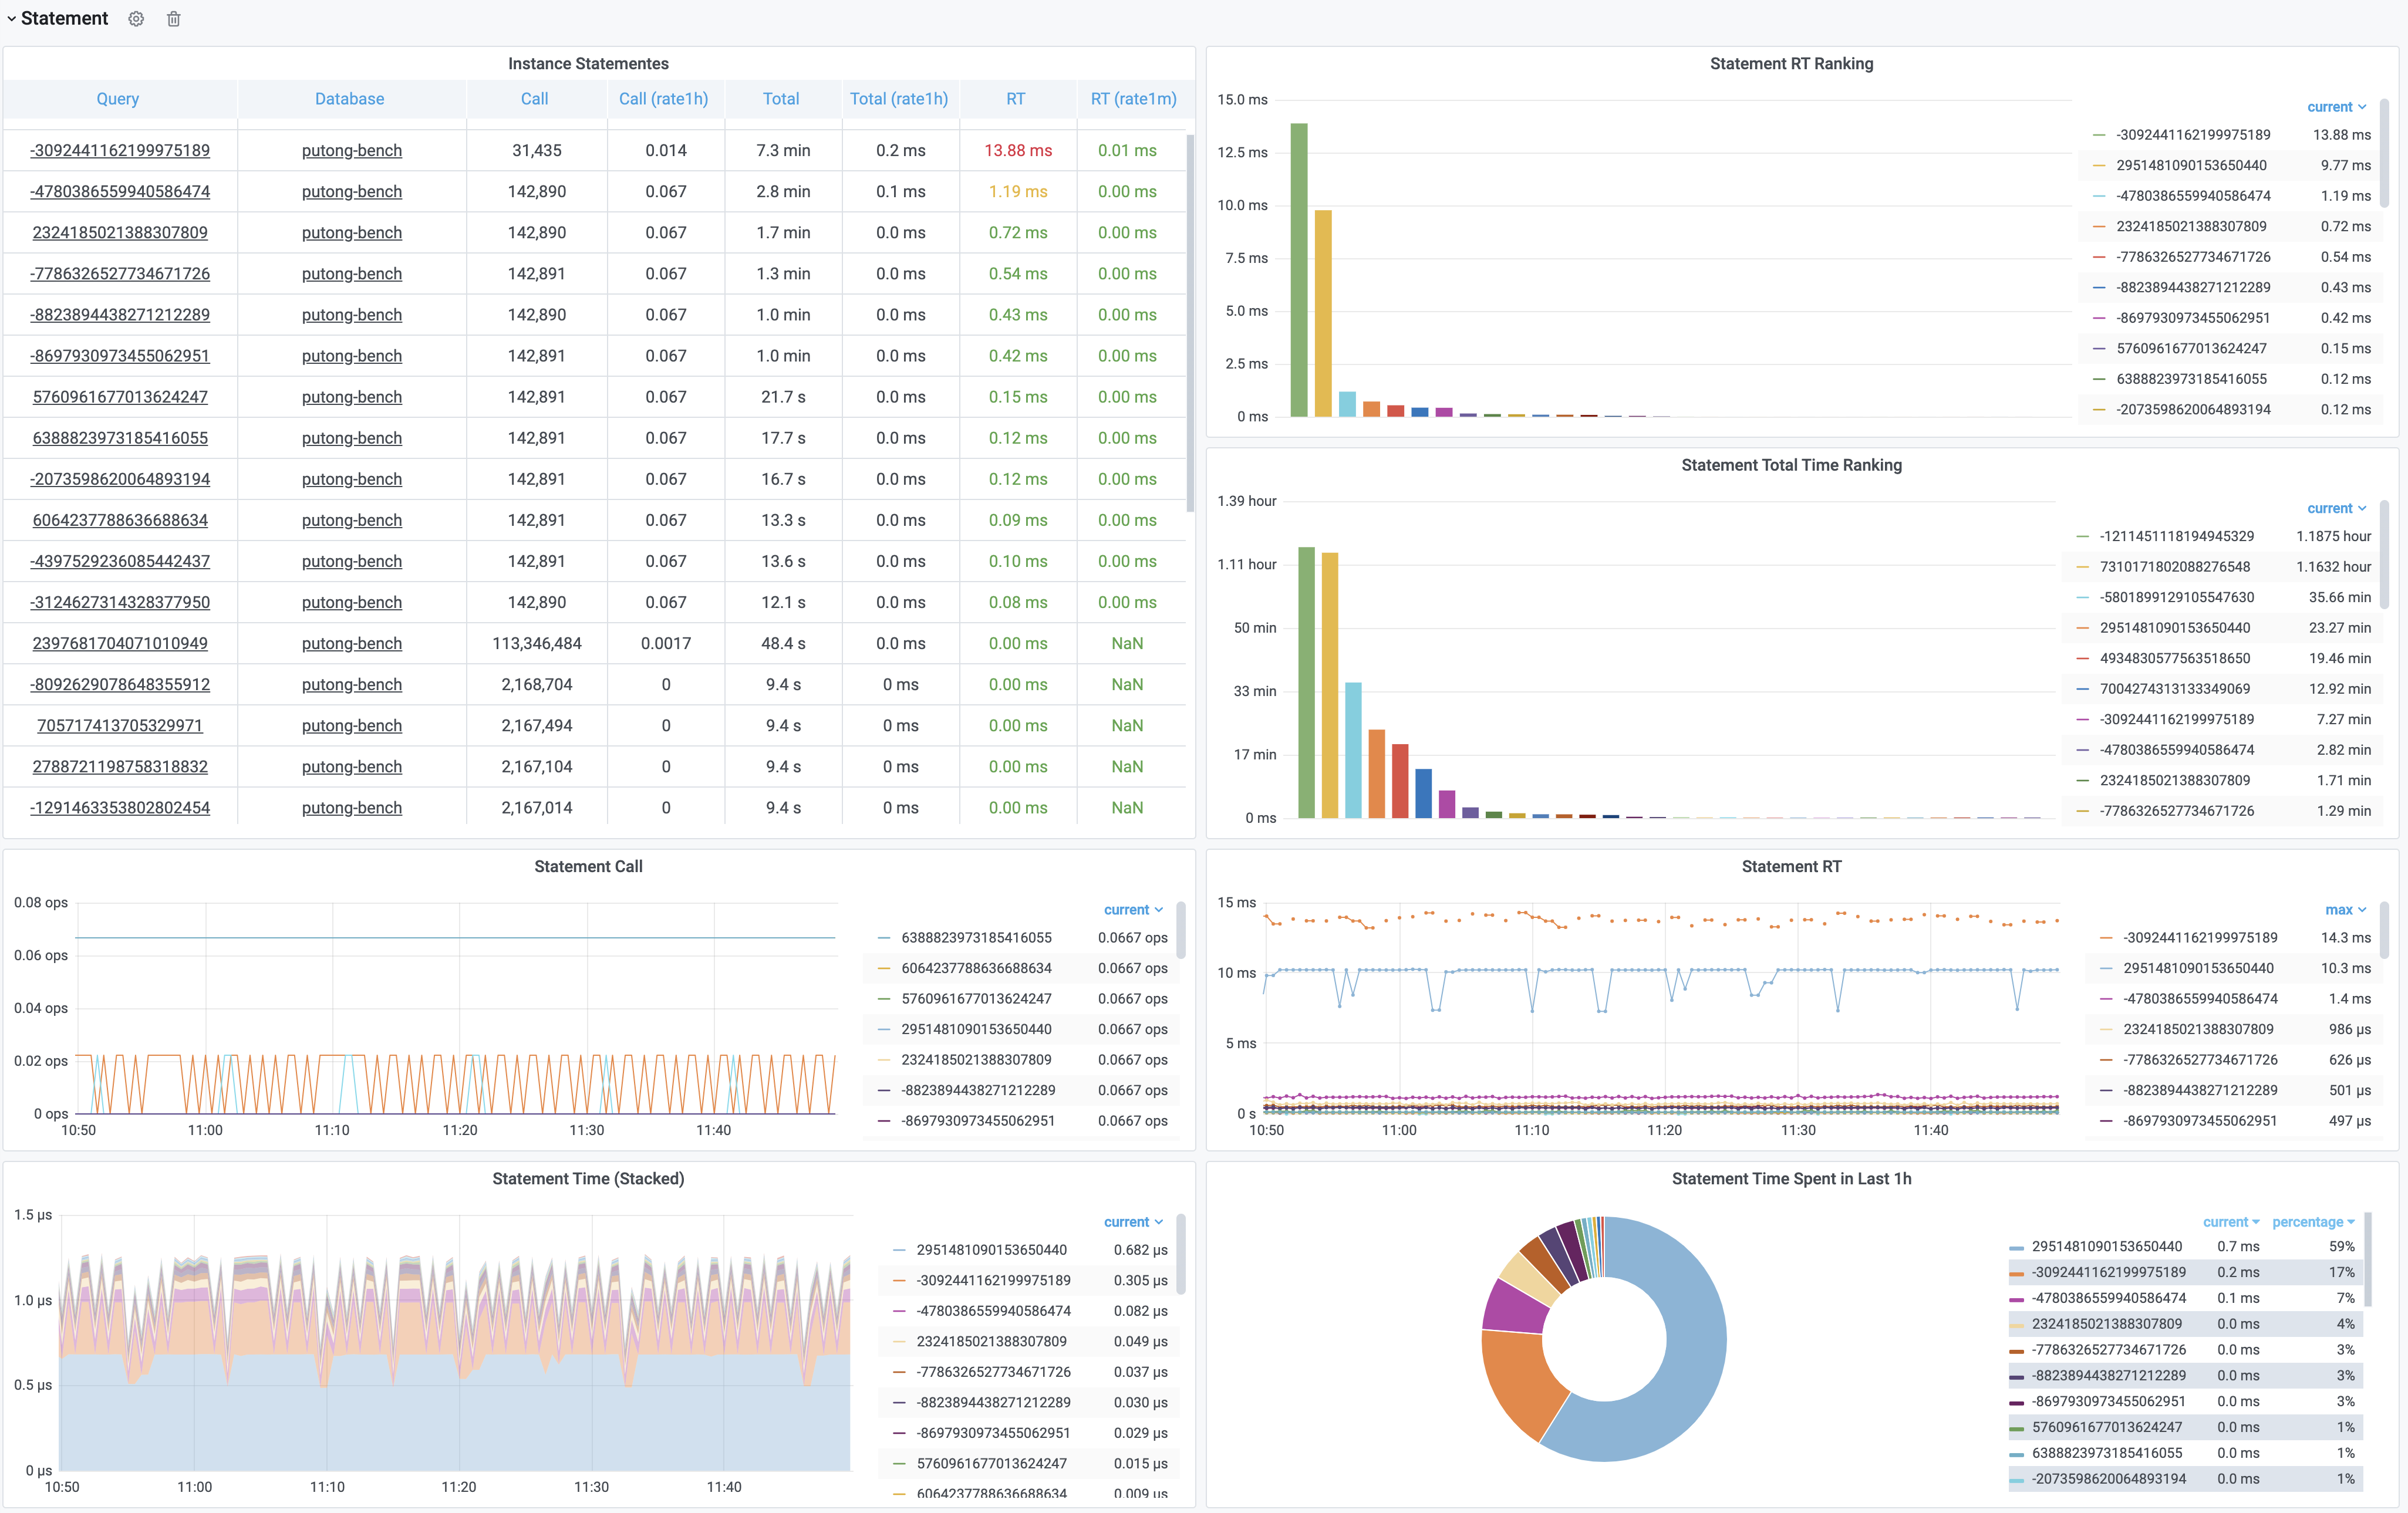
图:加工后的相关监控面板,PG Cluster Query看板部分截图
这里的表格数据经过一系列的加工处理,最终呈现为若干监控面板。最基本的数据加工是对表格中的原始数据进行标红上色,但也足以提供相当实用的改进:慢查询一览无余,但这不过是雕虫小技。重要的是,原始数据视图只能呈现当前时刻的快照;而通过Pigsty,用户可以回溯任意时刻或任意时间段。获取更深刻的性能洞察。
上图是集群视角下的查询看板 (PG Cluster Query),用户可以看到整个集群中所有查询的概览,包括每一类查询的QPS与RT,平均响应时间排名,以及耗费的总时间占比。
当用户对某一类具体查询感兴趣时,就可以点击查询ID,跳转到查询详情页(PG Query Detail)中。如下图所示。这里会显示查询的语句,以及一些核心指标。
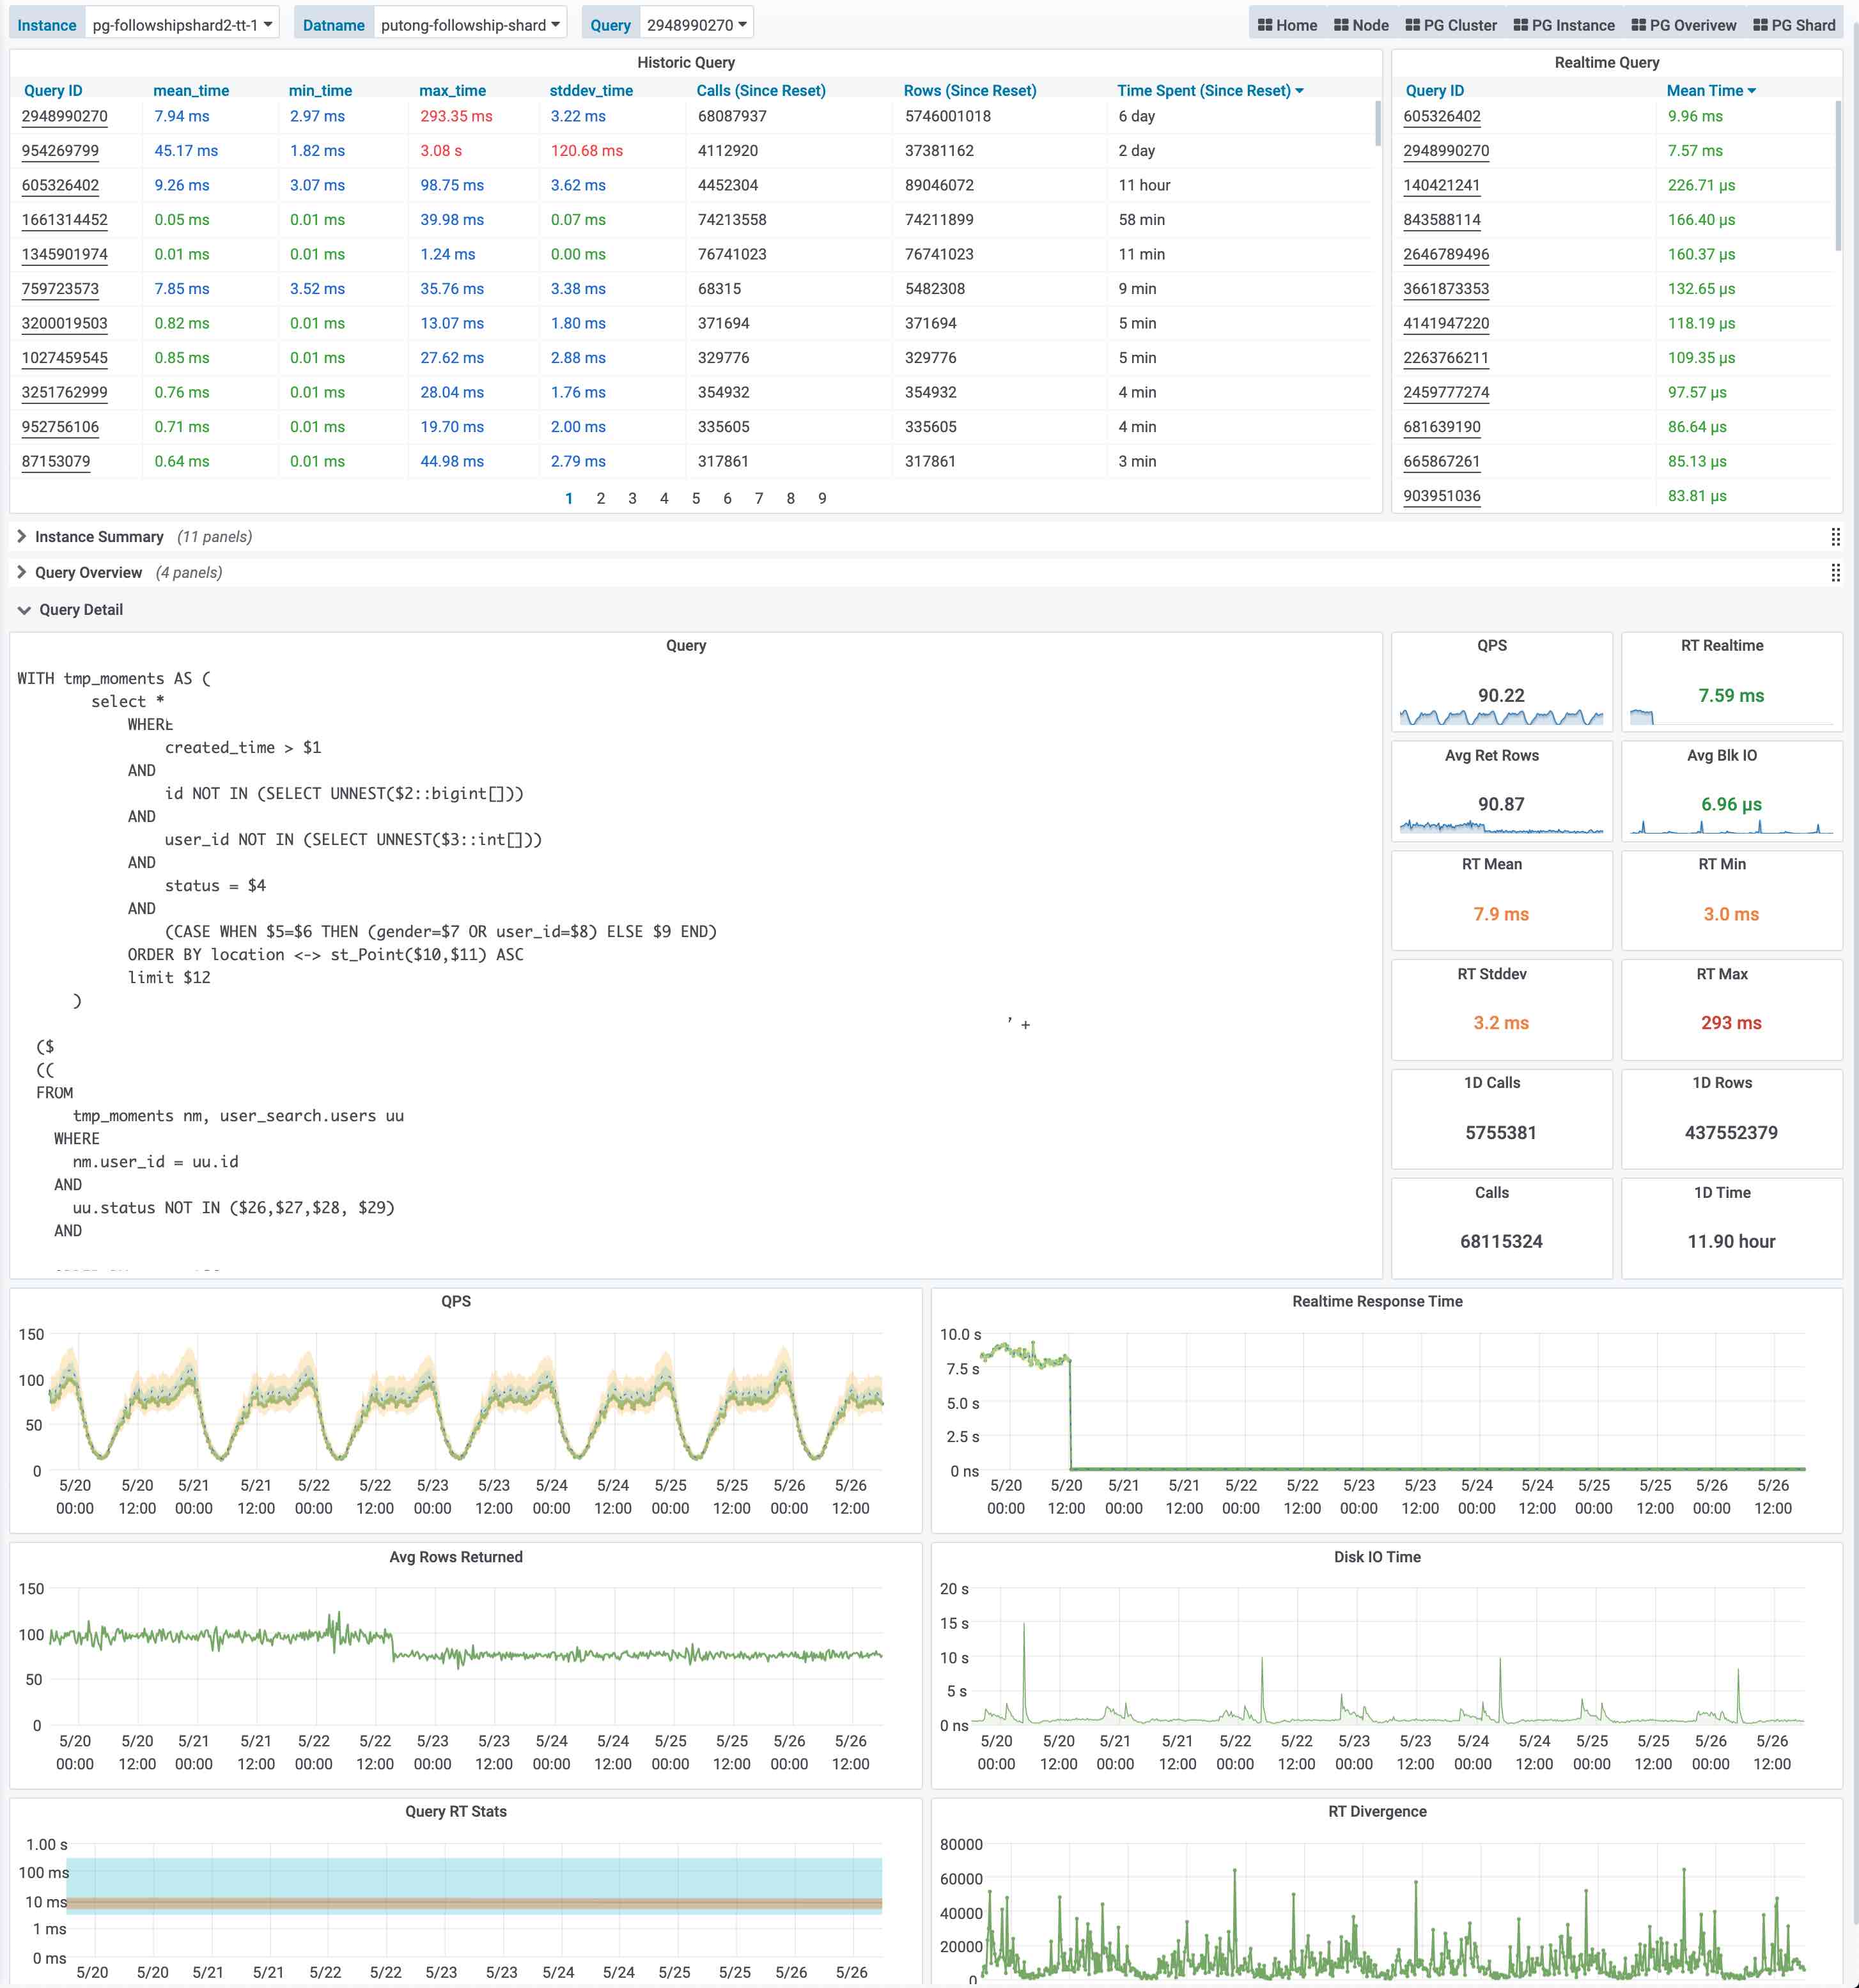
图:呈现单类查询的详细信息,PG Query Detail 看板截图
上图是实际生产环境中的一次慢查询优化记录,用户可以从右侧中间的Realtime Response Time 面板中发现一个突变。该查询的平均响应时间从七八秒突降到了七八毫秒。我们定位到了这个慢查询并添加了适当的索引,那么优化的效果就立刻在图表上以直观的形式展现出来,给出实时的反馈。
这就是Pigsty需要解决的核心问题:From observability to insight。
日志
除了指标外,还有一类重要的观测数据:日志(Log),日志是对离散事件的记录与描述。
如果说指标是对数据库系统的被动观测,那么日志就是数据库系统及其周边组件主动上报的信息。
Pigsty目前尚未对数据库日志进行挖掘,但在后续的版本中将集成pgbadger与mtail,引入日志统一收集、分析、处理的基础设施。并添加数据库日志相关的监控指标。
用户可以自行使用开源组件对PostgreSQL日志进行分析。
追踪
PostgreSQL提供了对DTrace的支持,用户也可以使用采样探针分析PostgreSQL查询执行时的性能瓶颈。但此类数据仅在某些特定场景会用到,实用性一般,因此Pigsty不会针对数据库收集Trace数据。
接下来?
只有指标并不够,我们还需要将这些信息组织起来,才能构建出体系来。阅读 监控层级 了解更多信息
3.3 - Identity Management
How does identity been managed in pigsty?
All instances have Identity, which is the metadata associated with the instance that identifies it.
!
Figure : Identity information with Postgres service when using Consul service discovery
Identity parameters
[identity-parameters](. /… /… /config/7-pg-provision/# identity-parameters) is a unique identifier that must be defined for any cluster and instance.
| name |
variables |
type |
description |
|
| cluster |
[pg_cluster](… /… /… /config/7-pg-provision/#pg_cluster) |
Core identity parameters |
Cluster name, top-level namespace for resources within the cluster |
|
| role |
[pg_role](. /… /… /config/7-pg-provision/#pg_role) |
Core identity parameters |
Instance role, primary, replica, offline, … |
|
| markers |
[pg_seq](… /… /… /config/7-pg-provision/#pg_seq) |
Core identity parameters |
Instance serial number, positive integer, unique within the cluster. |
|
| instance |
pg_instance |
derived identity parameter |
${pg_cluster}-${pg_seq} |
|
| service |
pg_service |
derived identity parameters |
${pg_cluster}-${pg_role} |
|
Identity association
After naming the objects in the system, you also need to associate identity information to specific instances.
Identity information is business-given metadata, and the database instance itself is not aware of this identity information; it does not know who it serves, which business it is subordinate to, or what number of instances it is in the cluster.
Identity assignment can take many forms, and the most rudimentary way to associate identities is Operator’s memory: the DBA remembers in his mind that the database instance on IP address 10.2.3.4 is the one used for payments, while the database instance on the other one is used for user management. A better way to manage the identity of cluster members is through profile, or by using service discovery.
Pigsty offers both ways of identity management: based on [Consul](. /identity/#consul service discovery), versus [Profile](. /identity/#static file service discovery)
Parameters [prometheus_sd_method (consul|static)](… /… /… /config/4-meta/#prometheus_sd_method) controls this behavior.
consul: service discovery based on Consul, default configurationstatic: service discovery based on local configuration files
Pigsty recommends using consul service discovery, where the monitoring system automatically corrects the identity registered by the target instance when a Failover occurs on the server.
Consul service discovery
Pigsty by default uses Consul service discovery to manage the services in your environment.
All services in Pigsty are automatically registered to the DCS, so metadata is automatically corrected when database clusters are created, destroyed, or modified, and the monitoring system can automatically discover monitoring targets without the need to manually maintain the configuration. The monitoring system can automatically discover the monitoring targets, eliminating the need for manual configuration maintenance.
Users can also use the DNS and service discovery mechanism provided by Consul to achieve automatic DNS-based traffic switching.
!
Consul uses a Client/Server architecture, and there are 1 to 5 Consul Servers ranging from 1 to 5 in the whole environment for the actual metadata storage. The Consul Agent is deployed on all nodes to proxy the communication between the native services and the Consul Server. pigsty registers the services by default by means of the local Consul configuration file.
Service Registration
On each node, there is a consul agent running, and services are registered to the DCS by the consul agent via JSON configuration files.
The default location of the JSON configuration file is /etc/consul.d/, using the naming convention of svc-<service>.json, using postgres as an example.
{
  "service": {
    "name": "postgres",
    "port": {{ pg_port }},
    "tags": [
      "{{ pg_role }}",
      "{{ pg_cluster }}"
    ],
    "meta": {
      "type": "postgres",
      "role": "{{ pg_role }}",
      "seq": "{{ pg_seq }}",
      "instance": "{{ pg_instance }}",
      "service": "{{ pg_service }}",
      "cluster": "{{ pg_cluster }}",
      "version": "{{ pg_version }}"
    },
    "check": {
      "tcp": "127.0.0.1:{{ pg_port }}",
      "interval": "15s",
      "timeout": "1s"
    }
  }
}
其中meta与tags部分是服务的元数据,存储有实例的身份信息。
服务查询
用户可以通过Consul提供的DNS服务,或者直接调用Consul API发现注册到Consul中的服务
使用DNS API查阅consul服务的方式,请参阅Consul文档。
图:查询pg-bench-1上的 pg_exporter 服务。
服务发现
Prometheus会自动通过consul_sd_configs发现环境中的监控对象。同时带有pg和exporter标签的服务会自动被识别为抓取对象:
- job_name: pg
  # https://prometheus.io/docs/prometheus/latest/configuration/configuration/#consul_sd_config
  consul_sd_configs:
    - server: localhost:8500
      refresh_interval: 5s
      tags:
        - pg
        - exporter
图:被Prometheus发现的服务,身份信息已关联至实例的指标维度上。
服务维护
有时候,因为数据库主从发生切换,导致注册的角色与数据库实例的实际角色出现偏差。这时候需要通过反熵过程处理这种异常。
基于Patroni的故障切换可以正常地通过回调逻辑修正注册的角色,但人工完成的角色切换则需要人工介入处理。
使用以下脚本可以自动检测并修复数据库的服务注册。建议在数据库实例上配置Crontab,或在元节点上设置定期巡检任务。
/pg/bin/pg-register $(pg-role)
静态文件服务发现
static服务发现依赖/etc/prometheus/targets/*.yml中的配置进行服务发现。采用这种方式的优势是不依赖Consul。
当Pigsty监控系统与外部管控方案集成时,这种模式对原系统的侵入性较小。但是缺点是,当集群内发生主从切换时,用户需要自行维护实例角色信息。手动维护时,可以根据以下命令从配置文件生成Prometheus所需的监控对象配置文件并载入生效。
详见 Prometheus服务发现。
./infra.yml --tags=prometheus_targtes,prometheus_reload
Pigsty默认生成的静态监控对象文件示例如下:
#==============================================================#
# File      :   targets/all.yml
# Ctime     :   2021-02-18
# Mtime     :   2021-02-18
# Desc      :   Prometheus Static Monitoring Targets Definition
# Path      :   /etc/prometheus/targets/all.yml
# Copyright (C) 2018-2021 Ruohang Feng
#==============================================================#

#======> pg-meta-1 [primary]
- labels: {cls: pg-meta, ins: pg-meta-1, ip: 10.10.10.10, role: primary, svc: pg-meta-primary}
  targets: [10.10.10.10:9630, 10.10.10.10:9100, 10.10.10.10:9631, 10.10.10.10:9101]

#======> pg-test-1 [primary]
- labels: {cls: pg-test, ins: pg-test-1, ip: 10.10.10.11, role: primary, svc: pg-test-primary}
  targets: [10.10.10.11:9630, 10.10.10.11:9100, 10.10.10.11:9631, 10.10.10.11:9101]

#======> pg-test-2 [replica]
- labels: {cls: pg-test, ins: pg-test-2, ip: 10.10.10.12, role: replica, svc: pg-test-replica}
  targets: [10.10.10.12:9630, 10.10.10.12:9100, 10.10.10.12:9631, 10.10.10.12:9101]

#======> pg-test-3 [replica]
- labels: {cls: pg-test, ins: pg-test-3, ip: 10.10.10.13, role: replica, svc: pg-test-replica}
  targets: [10.10.10.13:9630, 10.10.10.13:9100, 10.10.10.13:9631, 10.10.10.13:9101]
身份关联
无论是通过Consul服务发现,还是静态文件服务发现。最终的效果是实现身份信息与实例监控指标相互关联。
这一关联,是通过 监控指标 的维度标签实现的。
| 身份参数 |
维度标签 |
取值样例 |
pg_cluster |
cls |
pg-test |
pg_instance |
ins |
pg-test-1 |
pg_services |
svc |
pg-test-primary |
pg_role |
role |
primary |
node_ip |
ip |
10.10.10.11 |
阅读下一节 监控指标 ,了解这些指标是如何通过标签组织起来的。
3.4 - Metrics
Something about pigsty metrics: form, model, level, derived rules….
Metrics lies in the core part of pigsty monitoring system.
指标形式
指标在形式上是可累加的,原子性的逻辑计量单元,可在时间段上进行更新与统计汇总。
指标通常以 带有维度标签的时间序列 的形式存在。举个例子,Pigsty沙箱中的pg:ins:qps_realtime指展示了所有实例的实时QPS。
pg:ins:qps_realtime{cls="pg-meta", ins="pg-meta-1", ip="10.10.10.10", role="primary"} 0
pg:ins:qps_realtime{cls="pg-test", ins="pg-test-1", ip="10.10.10.11", role="primary"} 327.6
pg:ins:qps_realtime{cls="pg-test", ins="pg-test-2", ip="10.10.10.12", role="replica"} 517.0
pg:ins:qps_realtime{cls="pg-test", ins="pg-test-3", ip="10.10.10.13", role="replica"} 0
用户可以对指标进行运算:求和、求导,聚合,等等。例如:
$ sum(pg:ins:qps_realtime) by (cls)        -- 查询按集群聚合的 实时实例QPS
{cls="pg-meta"} 0
{cls="pg-test"} 844.6

$ avg(pg:ins:qps_realtime) by (cls)        -- 查询每个集群中 所有实例的平均 实时实例QPS
{cls="pg-meta"} 0
{cls="pg-test"} 280

$ avg_over_time(pg:ins:qps_realtime[30m])  -- 过去30分钟内实例的平均QPS
pg:ins:qps_realtime{cls="pg-meta", ins="pg-meta-1", ip="10.10.10.10", role="primary"} 0
pg:ins:qps_realtime{cls="pg-test", ins="pg-test-1", ip="10.10.10.11", role="primary"} 130
pg:ins:qps_realtime{cls="pg-test", ins="pg-test-2", ip="10.10.10.12", role="replica"} 100
pg:ins:qps_realtime{cls="pg-test", ins="pg-test-3", ip="10.10.10.13", role="replica"} 0
指标模型
每一个指标(Metric),都是一类数据,通常会对应多个时间序列(time series)。同一个指标对应的不同时间序列通过维度进行区分。
指标 + 维度,可以具体定位一个时间序列。每一个时间序列都是由 (时间戳,取值)二元组构成的数组。
Pigsty采用Prometheus的指标模型,其逻辑概念可以用以下的SQL DDL表示。
-- 指标表,指标与时间序列构成1:n关系
CREATE TABLE metrics (
    id   INT PRIMARY KEY,         -- 指标标识
    name TEXT UNIQUE              -- 指标名称,[...其他指标元数据,例如类型]
);

-- 时间序列表,每个时间序列都对应一个指标。
CREATE TABLE series (
    id        BIGINT PRIMARY KEY,               -- 时间序列标识
    metric_id INTEGER REFERENCES metrics (id),  -- 时间序列所属的指标
    dimension JSONB DEFAULT '{}'                -- 时间序列带有的维度信息,采用键值对的形式表示
);

-- 时许数据表,保存最终的采样数据点。每个采样点都属于一个时间序列
CREATE TABLE series_data (
    series_id BIGINT REFERENCES series(id),     -- 时间序列标识
    ts        TIMESTAMP,                        -- 采样点时间戳
    value     FLOAT,                            -- 采样点指标值
    PRIMARY KEY (series_id, ts)                 -- 每个采样点可以通过 所属时间序列 与 时间戳 唯一标识
);
这里我们以pg:ins:qps指标为例:
-- 样例指标数据
INSERT INTO metrics VALUES(1, 'pg:ins:qps');  -- 该指标名为 pg:ins:qps ,是一个 GAUGE。
INSERT INTO series VALUES                     -- 该指标包含有四个时间序列,通过维度标签区分
(1001, 1, '{"cls": "pg-meta", "ins": "pg-meta-1", "role": "primary", "other": "..."}'),
(1002, 1, '{"cls": "pg-test", "ins": "pg-test-1", "role": "primary", "other": "..."}'),
(1003, 1, '{"cls": "pg-test", "ins": "pg-test-2", "role": "replica", "other": "..."}'),
(1004, 1, '{"cls": "pg-test", "ins": "pg-test-3", "role": "replica", "other": "..."}');
INSERT INTO series_data VALUES                 -- 每个时间序列底层的采样点
(1001, now(), 1000),                           -- 实例 pg-meta-1 在当前时刻QPS为1000
(1002, now(), 1000),                           -- 实例 pg-test-1 在当前时刻QPS为1000
(1003, now(), 5000),                           -- 实例 pg-test-2 在当前时刻QPS为1000
(1004, now(), 5001);                           -- 实例 pg-test-3 在当前时刻QPS为5001
pg_up 是一个指标,包含有4个时间序列。记录了整个环境中所有实例的存活状态。pg_up{ins": "pg-test-1", ...}是一个时间序列,记录了特定实例pg-test-1 的存活状态
指标来源
Pigsty的监控数据主要有四种主要来源: 数据库,连接池,操作系统,负载均衡器。通过相应的exporter对外暴露。
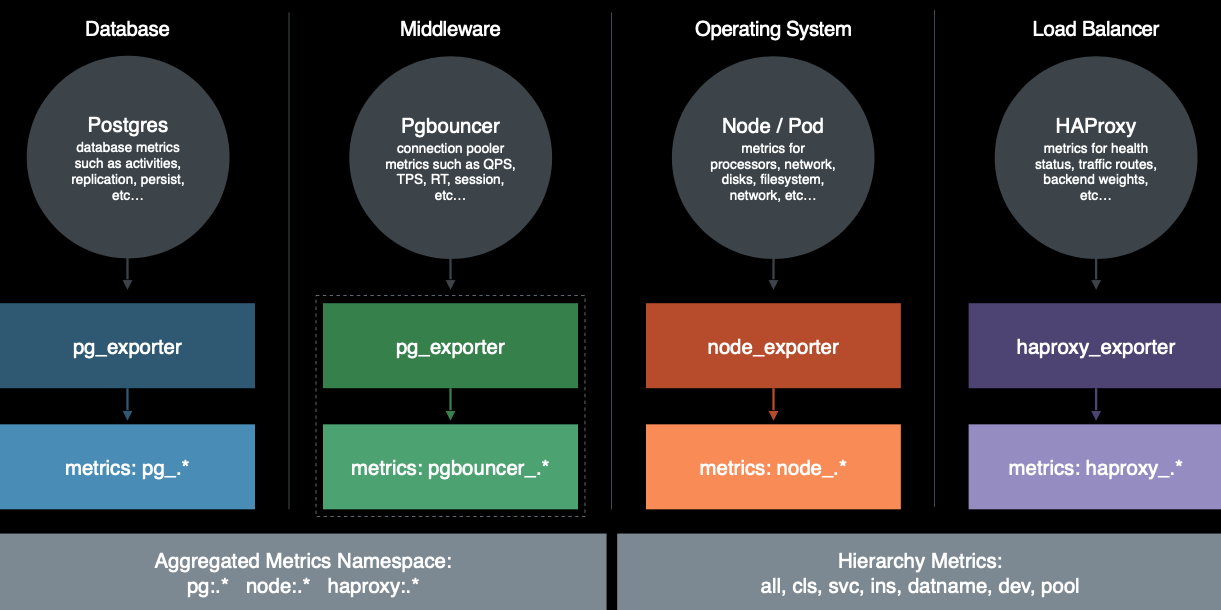
完整来源包括:
- PostgreSQL本身的监控指标
- PostgreSQL日志中的统计指标
- PostgreSQL系统目录信息
- Pgbouncer连接池中间价的指标
- PgExporter指标
- 数据库工作节点Node的指标
- 负载均衡器Haproxy指标
- DCS(Consul)工作指标
- 监控系统自身工作指标:Grafana,Prometheus,Nginx
- Blackbox探活指标
关于全部可用的指标清单,请查阅 参考-指标清单 一节
指标数量
那么,Pigsty总共包含了多少指标呢? 这里是一副各个指标来源占比的饼图。我们可以看到,右侧蓝绿黄对应的部分是数据库及数据库相关组件所暴露的指标,而左下方红橙色部分则对应着机器节点相关指标。左上方紫色部分则是负载均衡器的相关指标。
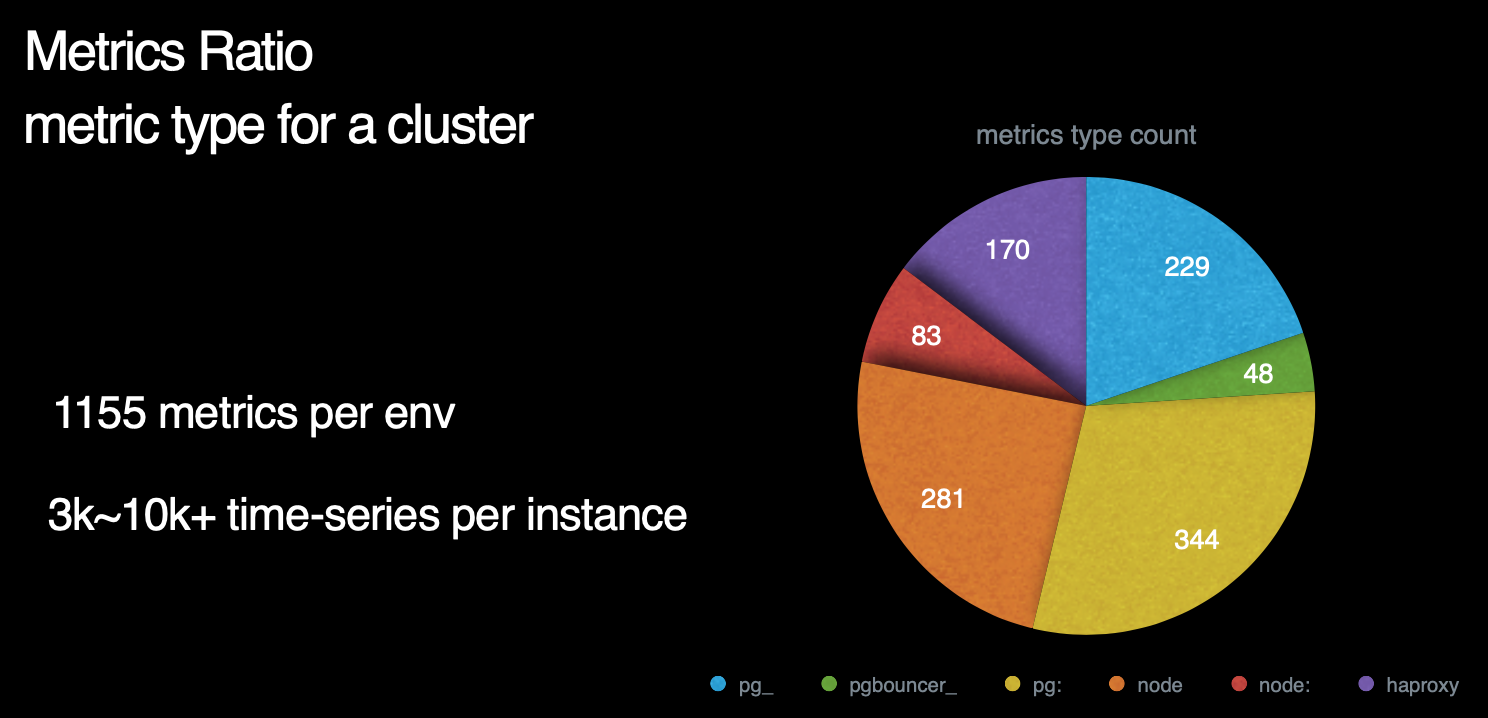
数据库指标中,与postgres本身有关的原始指标约230个,与中间件有关的原始指标约50个,基于这些原始指标,Pigsty又通过层次聚合与预计算,精心设计出约350个与DB相关的衍生指标。
因此,对于每个数据库集群来说,单纯针对数据库及其附件的监控指标就有621个。而机器原始指标281个,衍生指标83个一共364个。加上负载均衡器的170个指标,我们总共有接近1200类指标。
注意,这里我们必须辨析一下指标(metric)与时间序列( Time-series)的区别。
这里我们使用的量词是 类 而不是个 。 因为一个指标可能对应多个时间序列。例如一个数据库中有20张表,那么 pg_table_index_scan 这样的指标就会对应有20个对应的时间序列。
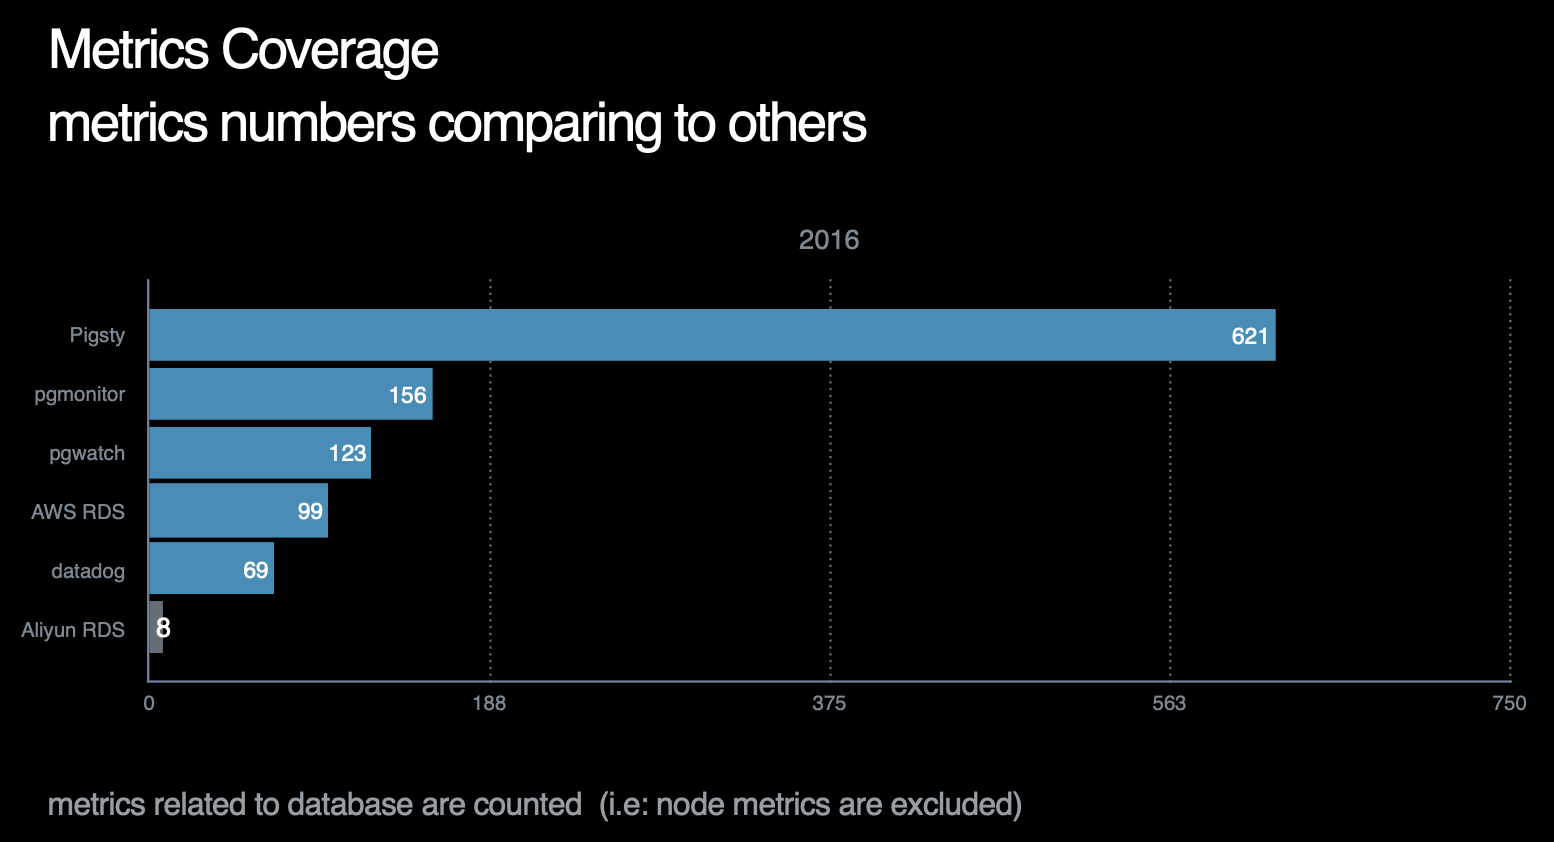
截止至2021年,Pigsty的指标覆盖率在所有作者已知的开源/商业监控系统中一骑绝尘,详情请参考横向对比。
指标层次
Pigsty还会基于现有指标进行加工处理,产出 衍生指标(Derived Metrics) 。
例如指标可以按照不同的层次进行聚合
从原始监控时间序列数据,到最终的成品图表,中间还有着若干道加工工序。
这里以TPS指标的衍生流程为例。
原始数据是从Pgbouncer抓取得到的事务计数器,集群中有四个实例,而每个实例上又有两个数据库,所以一个实例总共有8个DB层次的TPS指标。
而下面的图表,则是整个集群内每个实例的QPS横向对比,因此在这里,我们使用预定义的规则,首先对原始事务计数器求导获取8个DB层面的TPS指标,然后将8个DB层次的时间序列聚合为4个实例层次的TPS指标,最后再将这四个实例级别的TPS指标聚合为集群层次的TPS指标。
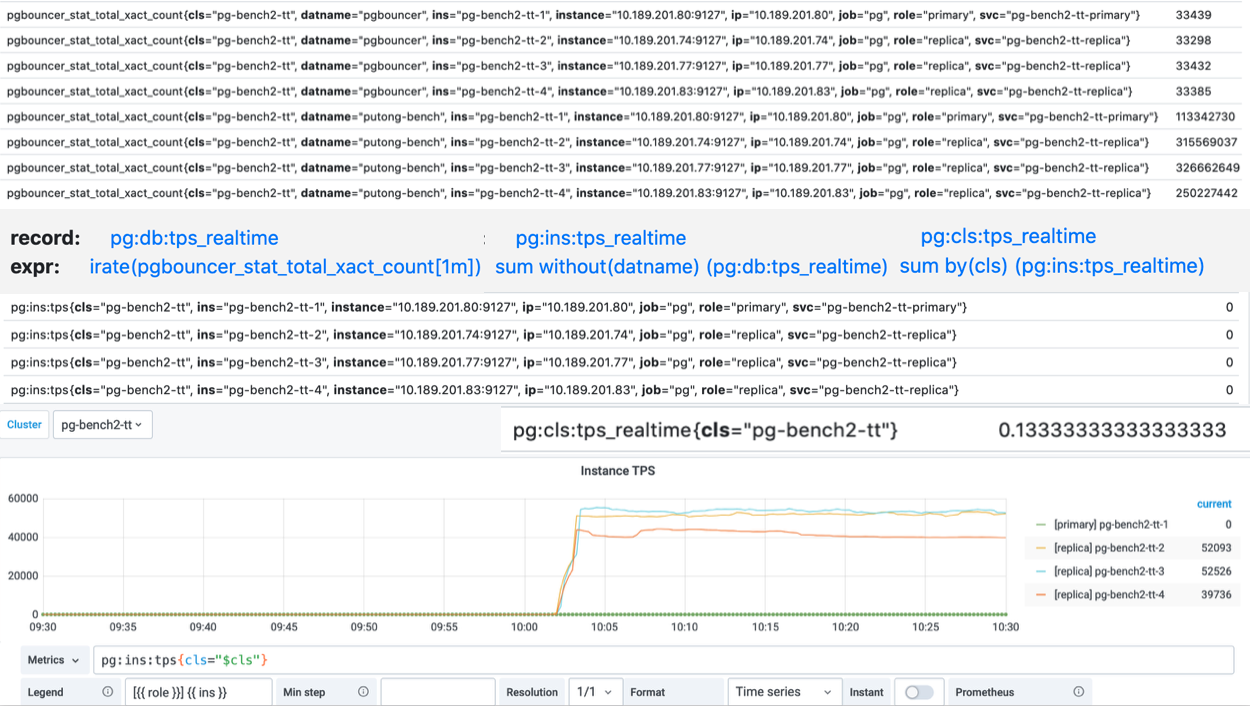
Pigsty共定义了360类衍生聚合指标,后续还会不断增加。衍生指标定义规则详见 参考-衍生指标
特殊指标
目录(Catalog) 是一种特殊的指标
Catalog与Metrics比较相似但又不完全相同,边界比较模糊。最简单的例子,一个表的页面数量和元组数量,应该算Catalog还是算Metrics?
跳过这种概念游戏,实践上Catalog和Metrics主要的区别是,Catalog里的信息通常是不怎么变化的,比如表的定义之类的,如果也像Metrics这样比如几秒抓一次,显然是一种浪费。所以我们会将这一类偏静态的信息划归Catalog。
Catalog主要由定时任务(例如巡检)负责抓取,而不由Prometheus采集。一些特别重要的Catalog信息,例如pg_class中的一些信息,也会转换为指标被Prometheus所采集。
小结
了解了Pigsty指标后,不妨了解一下Pigsty的 报警系统 是如何将这些指标数据用于实际生产用途的。
3.5 - Alert Rules
Introduction to built-in alert rules, and how to add new
Alerts are critical to daily fault response and to improve system availability.
Missed alarms lead to reduced availability and false alarms lead to reduced sensitivity, necessitating a prudent design of alarm rules.
- Reasonable definition of alarm levels and the corresponding processing flow
- Reasonable definition of alarm indicators, removal of duplicate alarm items, and supplementation of missing alarm items
- Scientific configuration of alarm thresholds based on historical monitoring data to reduce the false alarm rate.
- Reasonable sparse special case rules to eliminate false alarms caused by maintenance work, ETL, and offline query.
Alert taxonomy
**By Urgency **
-
P0: FATAL: Incidents that have significant off-site impact and require urgent intervention to handle. For example, main library down, replication outage. (Serious incident)
-
P1: ERROR: Incidents with minor off-site impact, or incidents with redundant processing, requiring response processing at the minute level. (Incident)
-
P2: WARNING: imminent impact, let loose may worsen at the hourly level, response is required at the hourly level. (Incident of concern)
-
P3: NOTICE: Needs attention, will not have an immediate impact, but needs to be responded to within the day level. (Deviation phenomena)
By Level
- DBA will only pay special attention to CPU and disk alarms, and the rest is the responsibility of operation and maintenance.
- Database level: Alarms of database itself, DBA focus on. This is generated by PG, PGB, and Exporter’s own monitoring metrics.
- Application level: Application alarms are the responsibility of the business side itself, but DBA will set alarms for business metrics such as QPS, TPS, Rollback, Seasonality, etc.
By Metric Type
- Errors: PG Down, PGB Down, Exporter Down, Stream Replication Outage, Single Set Cluster Multi-Master
- Traffic: QPS, TPS, Rollback, Seasonality
- Latency: Average Response Time, Replication Latency
- Saturation: Connection Stacking, Number of Idle Transactions, CPU, Disk, Age (Transaction Number), Buffers
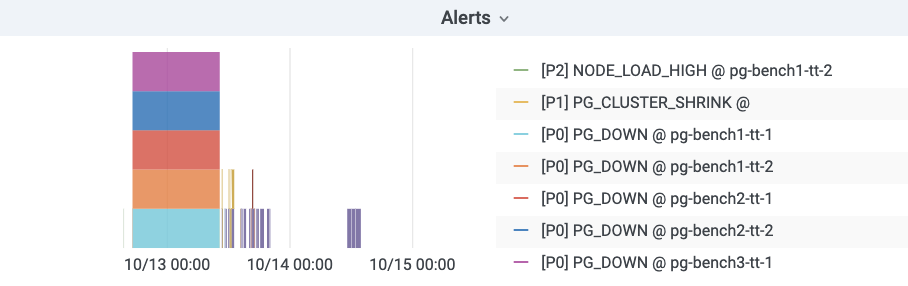
Alarm Visualization
Pigsty uses bar graphs to present alarm information. The horizontal axis represents the time period and a color bar represents the alarm event. Only alarms that are in the Firing state are displayed in the alarm chart.
Alarm rules in detail
Alarm rules can be roughly divided into four categories by type: error, delay, saturation, and flow. Among them.
- Errors: mainly concerned with the survivability (Aliveness) of each component, as well as network outages, brain fractures and other abnormalities, the level is usually higher (P0|P1).
- Latency: mainly concerned with query response time, replication latency, slow queries, and long transactions.
- Saturation: mainly focus on CPU, disk (these two belong to system monitoring but very important for DB so incorporate), connection pool queue, number of database back-end connections, age (essentially the saturation of available thing numbers), SSD life, etc.
- Traffic: QPS, TPS, Rollback (traffic is usually related to business metrics belongs to business monitoring, but incorporated because it is important for DB), seasonality of QPS, burst of TPS.
Error Alarm
Postgres instance downtime distinguishes between master and slave, master library downtime triggers P0 alarm, slave library downtime triggers P1 alarm. Both require immediate intervention, but slave libraries usually have multiple instances and can be downgraded to query on the master library, which has a higher processing margin, so slave library downtime is designated as P1.
# primary|master instance down for 1m triggers a P0 alert
- alert: PG_PRIMARY_DOWN
  expr: pg_up{instance=~'.*master.*'}
  for: 1m
  labels:
    team: DBA
    urgency: P0
  annotations:
    summary: "P0 Postgres Primary Instance Down: {{$labels.instance}}"
    description: "pg_up = {{ $value }} {{$labels.instance}}"

# standby|slave instance down for 1m triggers a P1 alert
- alert: PG_STANDBY_DOWN
  expr: pg_up{instance!~'.*master.*'}
  for: 1m
  labels:
    team: DBA
    urgency: P1
  annotations:
    summary: "P1 Postgres Standby Instance Down: {{$labels.instance}}"
    description: "pg_up = {{ $value }} {{$labels.instance}}"
Pgbouncer实例因为与Postgres实例一一对应,其存活性报警规则与Postgres统一。
# primary pgbouncer down for 1m triggers a P0 alert
- alert: PGB_PRIMARY_DOWN
  expr: pgbouncer_up{instance=~'.*master.*'}
  for: 1m
  labels:
    team: DBA
    urgency: P0
  annotations:
    summary: "P0 Pgbouncer Primary Instance Down: {{$labels.instance}}"
    description: "pgbouncer_up = {{ $value }} {{$labels.instance}}"

# standby pgbouncer down for 1m triggers a P1 alert
- alert: PGB_STANDBY_DOWN
  expr: pgbouncer_up{instance!~'.*master.*'}
  for: 1m
  labels:
    team: DBA
    urgency: P1
  annotations:
    summary: "P1 Pgbouncer Standby Instance Down: {{$labels.instance}}"
    description: "pgbouncer_up = {{ $value }} {{$labels.instance}}"
Prometheus Exporter的存活性定级为P1,虽然Exporter宕机本身并不影响数据库服务,但这通常预示着一些不好的情况,而且监控数据的缺失也会产生某些相应的报警。Exporter的存活性是通过Prometheus自己的up指标检测的,需要注意某些单实例多DB的特例。
# exporter down for 1m triggers a P1 alert
- alert: PG_EXPORTER_DOWN
  expr: up{port=~"(9185|9127)"} == 0
  for: 1m
  labels:
    team: DBA
    urgency: P1
  annotations:
    summary: "P1 Exporter Down: {{$labels.instance}} {{$labels.port}}"
    description: "port = {{$labels.port}}, {{$labels.instance}}"
所有存活性检测的持续时间阈值设定为1分钟,对15s的默认采集周期而言是四个样本点。常规的重启操作通常不会触发存活性报警。
延迟报警
与复制延迟有关的报警有三个:复制中断,复制延迟高,复制延迟异常,分别定级为P1, P2, P3
-
其中复制中断是一种错误,使用指标:pg_repl_state_count{state="streaming"}进行判断,当前streaming状态的从库如果数量发生负向变动,则触发break报警。walsender会决定复制的状态,从库直接断开会产生此现象,缓冲区出现积压时会从streaming进入catchup状态也会触发此报警。此外,采用-Xs手工制作备份结束时也会产生此报警,此报警会在10分钟后自动Resolve。复制中断会导致客户端读到陈旧的数据,具有一定的场外影响,定级为P1。
-
复制延迟可以使用延迟时间或者延迟字节数判定。以延迟字节数为权威指标。常规状态下,复制延迟时间在百毫秒量级,复制延迟字节在百KB量级均属于正常。目前采用的是5s,15s的时间报警阈值。根据历史经验数据,这里采用了时间8秒与字节32MB的阈值,大致报警频率为每天个位数个。延迟时间更符合直觉,所以采用8s的P2报警,但并不是所有的从库都能有效取到该指标所以使用32MB的字节阈值触发P3报警补漏。
-
特例:antispam,stats,coredb均经常出现复制延迟。
      # replication break for 1m triggers a P0 alert. auto-resolved after 10 minutes.
      - alert: PG_REPLICATION_BREAK
        expr: pg_repl_state_count{state="streaming"} - (pg_repl_state_count{state="streaming"} OFFSET 10m) < 0
        for: 1m
        labels:
          team: DBA
          urgency: P0
        annotations:
          summary: "P0 Postgres Streaming Replication Break: {{$labels.instance}}"
          description: "delta = {{ $value }} {{$labels.instance}}"

      # replication lag greater than 8 second for 3m triggers a P1 alert
      - alert: PG_REPLICATION_LAG
        expr: pg_repl_replay_lag{application_name="walreceiver"} > 8
        for: 3m
        labels:
          team: DBA
          urgency: P1
        annotations:
          summary: "P1 Postgres Replication Lagged: {{$labels.instance}}"
          description: "lag = {{ $value }} seconds, {{$labels.instance}}"

      # replication diff greater than 32MB for 5m triggers a P3 alert
      - alert: PG_REPLICATOIN_DIFF
        expr: pg_repl_lsn{application_name="walreceiver"} - pg_repl_replay_lsn{application_name="walreceiver"} > 33554432
        for: 5m
        labels:
          team: DBA
          urgency: P3
        annotations:
          summary: "P3 Postgres Replication Diff Deviant: {{$labels.instance}}"
          description: "delta = {{ $value }} {{$labels.instance}}"
饱和度报警
饱和度指标主要资源,包含很多系统级监控的指标。主要包括:CPU,磁盘(这两个属于系统监控但对于DB非常重要所以纳入),连接池排队,数据库后端连接数,年龄(本质是可用事物号的饱和度),SSD寿命等。
堆积检测
堆积主要包含两类指标,一方面是PG本身的后端连接数与活跃连接数,另一方面是连接池的排队情况。
PGB排队是决定性的指标,它代表用户端可感知的阻塞已经出现,因此,配置排队超过15持续1分钟触发P0报警。
# more than 8 client waiting in queue for 1 min triggers a P0 alert
- alert: PGB_QUEUING
  expr: sum(pgbouncer_pool_waiting_clients{datname!="pgbouncer"}) by (instance,datname) > 8
  for: 1m
  labels:
    team: DBA
    urgency: P0
  annotations:
    summary: "P0 Pgbouncer {{ $value }} Clients Wait in Queue: {{$labels.instance}}"
    description: "waiting clients = {{ $value }} {{$labels.instance}}"
后端连接数是一个重要的报警指标,如果后端连接持续达到最大连接数,往往也意味着雪崩。连接池的排队连接数也能反映这种情况,但不能覆盖应用直连数据库的情况。后端连接数的主要问题是它与连接池关系密切,连接池在短暂堵塞后会迅速打满后端连接,但堵塞恢复后这些连接必须在默认约10min的Timeout后才被释放。因此收到短暂堆积的影响较大。同时外晚上1点备份时也会出现这种情况,容易产生误报。
注意后端连接数与后端活跃连接数不同,目前报警使用的是活跃连接数。后端活跃连接数通常在0~1,一些慢库在十几左右,离线库可能会达到20~30。但后端连接/进程数(不管活跃不活跃),通常均值可达50。后端连接数更为直观准确。
对于后端连接数,这里使用两个等级的报警:超过90持续3分钟P1,以及超过80持续10分钟P2,考虑到通常数据库最大连接数为100。这样做可以以尽可能低的误报率检测到雪崩堆积。
# num of backend exceed 90 for 3m
- alert: PG_BACKEND_HIGH
  expr: sum(pg_db_numbackends) by (node) > 90
  for: 3m
  labels:
    team: DBA
    urgency: P1
  annotations:
    summary: "P1 Postgres Backend Number High: {{$labels.instance}}"
    description: "numbackend = {{ $value }} {{$labels.instance}}"

# num of backend exceed 80 for 10m (avoid pgbouncer jam false alert)
- alert: PG_BACKEND_WARN
  expr: sum(pg_db_numbackends) by (node) > 80
  for: 10m
  labels:
    team: DBA
    urgency: P2
  annotations:
    summary: "P2 Postgres Backend Number Warn: {{$labels.instance}}"
    description: "numbackend = {{ $value }} {{$labels.instance}}"
空闲事务
目前监控使用IDEL In Xact的绝对数量作为报警条件,其实 Idle In Xact的最长持续时间可能会更有意义。因为这种现象其实已经被后端连接数覆盖了。长时间的空闲是我们真正关注的,因此这里使用所有空闲事务中最高的闲置时长作为报警指标。设置3分钟为P2报警阈值。经常出现IDLE的非Offline库有:moderation, location, stats,sms, device, moderationdevice
# max idle xact duration exceed 3m
- alert: PG_IDLE_XACT
  expr: pg_activity_max_duration{instance!~".*offline.*", state=~"^idle in transaction.*"} > 180
  for: 3m
  labels:
    team: DBA
    urgency: P2
  annotations:
    summary: "P2 Postgres Long Idle Transaction: {{$labels.instance}}"
    description: "duration = {{ $value }} {{$labels.instance}}"
资源报警
CPU, 磁盘,AGE
默认清理年龄为2亿,超过10Y报P1,既留下了充分的余量,又不至于让人忽视。
# age wrap around (progress in half 10Y) triggers a P1 alert
- alert: PG_XID_WRAP
  expr: pg_database_age{} > 1000000000
  for: 3m
  labels:
    team: DBA
    urgency: P1
  annotations:
    summary: "P1 Postgres XID Wrap Around: {{$labels.instance}}"
    description: "age = {{ $value }} {{$labels.instance}}"
磁盘和CPU由运维配置,不变
流量
因为各个业务的负载情况不一,为流量指标设置绝对值是相对困难的。这里只对TPS和Rollback设置绝对值指标。而且较为宽松。
Rollback OPS超过4则发出P3警告,TPS超过24000发P2,超过30000发P1
# more than 30k TPS lasts for 1m triggers a P1 (pgbouncer bottleneck)
- alert: PG_TPS_HIGH
  expr: rate(pg_db_xact_total{}[1m]) > 30000
  for: 1m
  labels:
    team: DBA
    urgency: P1
  annotations:
    summary: "P1 Postgres TPS High: {{$labels.instance}} {{$labels.datname}}"
    description: "TPS = {{ $value }} {{$labels.instance}}"

# more than 24k TPS lasts for 3m triggers a P2
- alert: PG_TPS_WARN
  expr: rate(pg_db_xact_total{}[1m]) > 24000
  for: 3m
  labels:
    team: DBA
    urgency: P2
  annotations:
    summary: "P2 Postgres TPS Warning: {{$labels.instance}} {{$labels.datname}}"
    description: "TPS = {{ $value }} {{$labels.instance}}"

# more than 4 rollback per seconds lasts for 5m
- alert: PG_ROLLBACK_WARN
  expr: rate(pg_db_xact_rollback{}[1m]) > 4
  for: 5m
  labels:
    team: DBA
    urgency: P2
  annotations:
    summary: "P2 Postgres Rollback Warning: {{$labels.instance}}"
    description: "rollback per sec = {{ $value }} {{$labels.instance}}"
QPS的指标与业务高度相关,因此不适合配置绝对值,可以为QPS突增配置一个报警项
短时间(和10分钟)前比突增30%会触发一个P2警报,同时避免小QPS下的突发流量,设置一个绝对阈值10k
# QPS > 10000 and have a 30% inc for 3m triggers P2 alert
- alert: PG_QPS_BURST
  expr: sum by(datname,instance)(rate(pgbouncer_stat_total_query_count{datname!="pgbouncer"}[1m]))/sum by(datname,instance) (rate(pgbouncer_stat_total_query_count{datname!="pgbouncer"}[1m] offset 10m)) > 1.3 and sum by(datname,instance) (rate(pgbouncer_stat_total_query_count{datname!="pgbouncer"}[1m])) > 10000
  for: 3m
  labels:
    team: DBA
    urgency: P1
  annotations:
    summary: "P2 Pgbouncer QPS Burst 30% and exceed 10000: {{$labels.instance}}"
    description: "qps = {{ $value }} {{$labels.instance}}"
Prometheus报警规则
完整的报警规则详见:参考-报警规则
4 - Provisioning
Concepts about pigsty provisioning systems
By Provisioning Solution, we mean a system that delivers database services and monitoring systems to users.
Provisioning Solution is not a database, but a database factory.
The user submits a configuration to the provisioning system, and the provisioning system creates the required database cluster in the environment according to the user’s desired specifications.
This is more similar to submitting a YAML file to Kubernetes to create the various resources required.
Defining a database cluster
For example, the following configuration information declares a set of PostgreSQL database clusters named pg-test.
#-----------------------------
# cluster: pg-test
#-----------------------------
pg-test: # define cluster named 'pg-test'
  # - cluster members - #
  hosts:
    10.10.10.11: {pg_seq: 1, pg_role: primary, ansible_host: node-1}
    10.10.10.12: {pg_seq: 2, pg_role: replica, ansible_host: node-2}
    10.10.10.13: {pg_seq: 3, pg_role: offline, ansible_host: node-3}

  # - cluster configs - #
  vars:
    # basic settings
    pg_cluster: pg-test                 # define actual cluster name
    pg_version: 13                      # define installed pgsql version
    node_tune: tiny                     # tune node into oltp|olap|crit|tiny mode
    pg_conf: tiny.yml                   # tune pgsql into oltp/olap/crit/tiny mode

    # business users, adjust on your own needs
    pg_users:
      - name: test                      # example production user have read-write access
        password: test                  # example user's password
        roles: [dbrole_readwrite]       # dborole_admin|dbrole_readwrite|dbrole_readonly|dbrole_offline
        pgbouncer: true                 # production user that access via pgbouncer
        comment: default test user for production usage

    pg_databases:                       # create a business database 'test'
      - name: test                      # use the simplest form

    pg_default_database: test           # default database will be used as primary monitor target

    # proxy settings
    vip_mode: l2                        # enable/disable vip (require members in same LAN)
    vip_address: 10.10.10.3             # virtual ip address
    vip_cidrmask: 8                     # cidr network mask length
    vip_interface: eth1                 # interface to add virtual ip
When executing database provisioning script . /pgsql.yml, the provisioning system will generate a one-master-two-slave PostgreSQL cluster pg-test on the three machines 10.10.10.11, 10.10.10.12, and 10.10.10.13, as defined in the manifest. And create a user and database named test. At the same time, Pigsty will also declare a 10.10.10.3 VIP binding on top of the cluster’s master library upon request. The structure is shown in the figure below.
Defining the infrastructure
The user is able to define not only the database cluster, but also the entire infrastructure.
Pigsty implements a complete representation of the database runtime environment with 154 variables.
For detailed configurable items, please refer to the Configuration Guide
Responsibilities of the provisioning scheme
The provisioning solution is usually only responsible for the creation of the cluster. Once the cluster is created, the day-to-day management should be the responsibility of the control platform.
However, Pigsty does not currently include a control platform component, so a simple resource recovery and destruction script is provided and can also be used for resource updates and management. However, it is not the job of the provisioning solution to do this.
4.1 - DB Access
How to access database?
Database access methods
Users can access the database services in several ways.
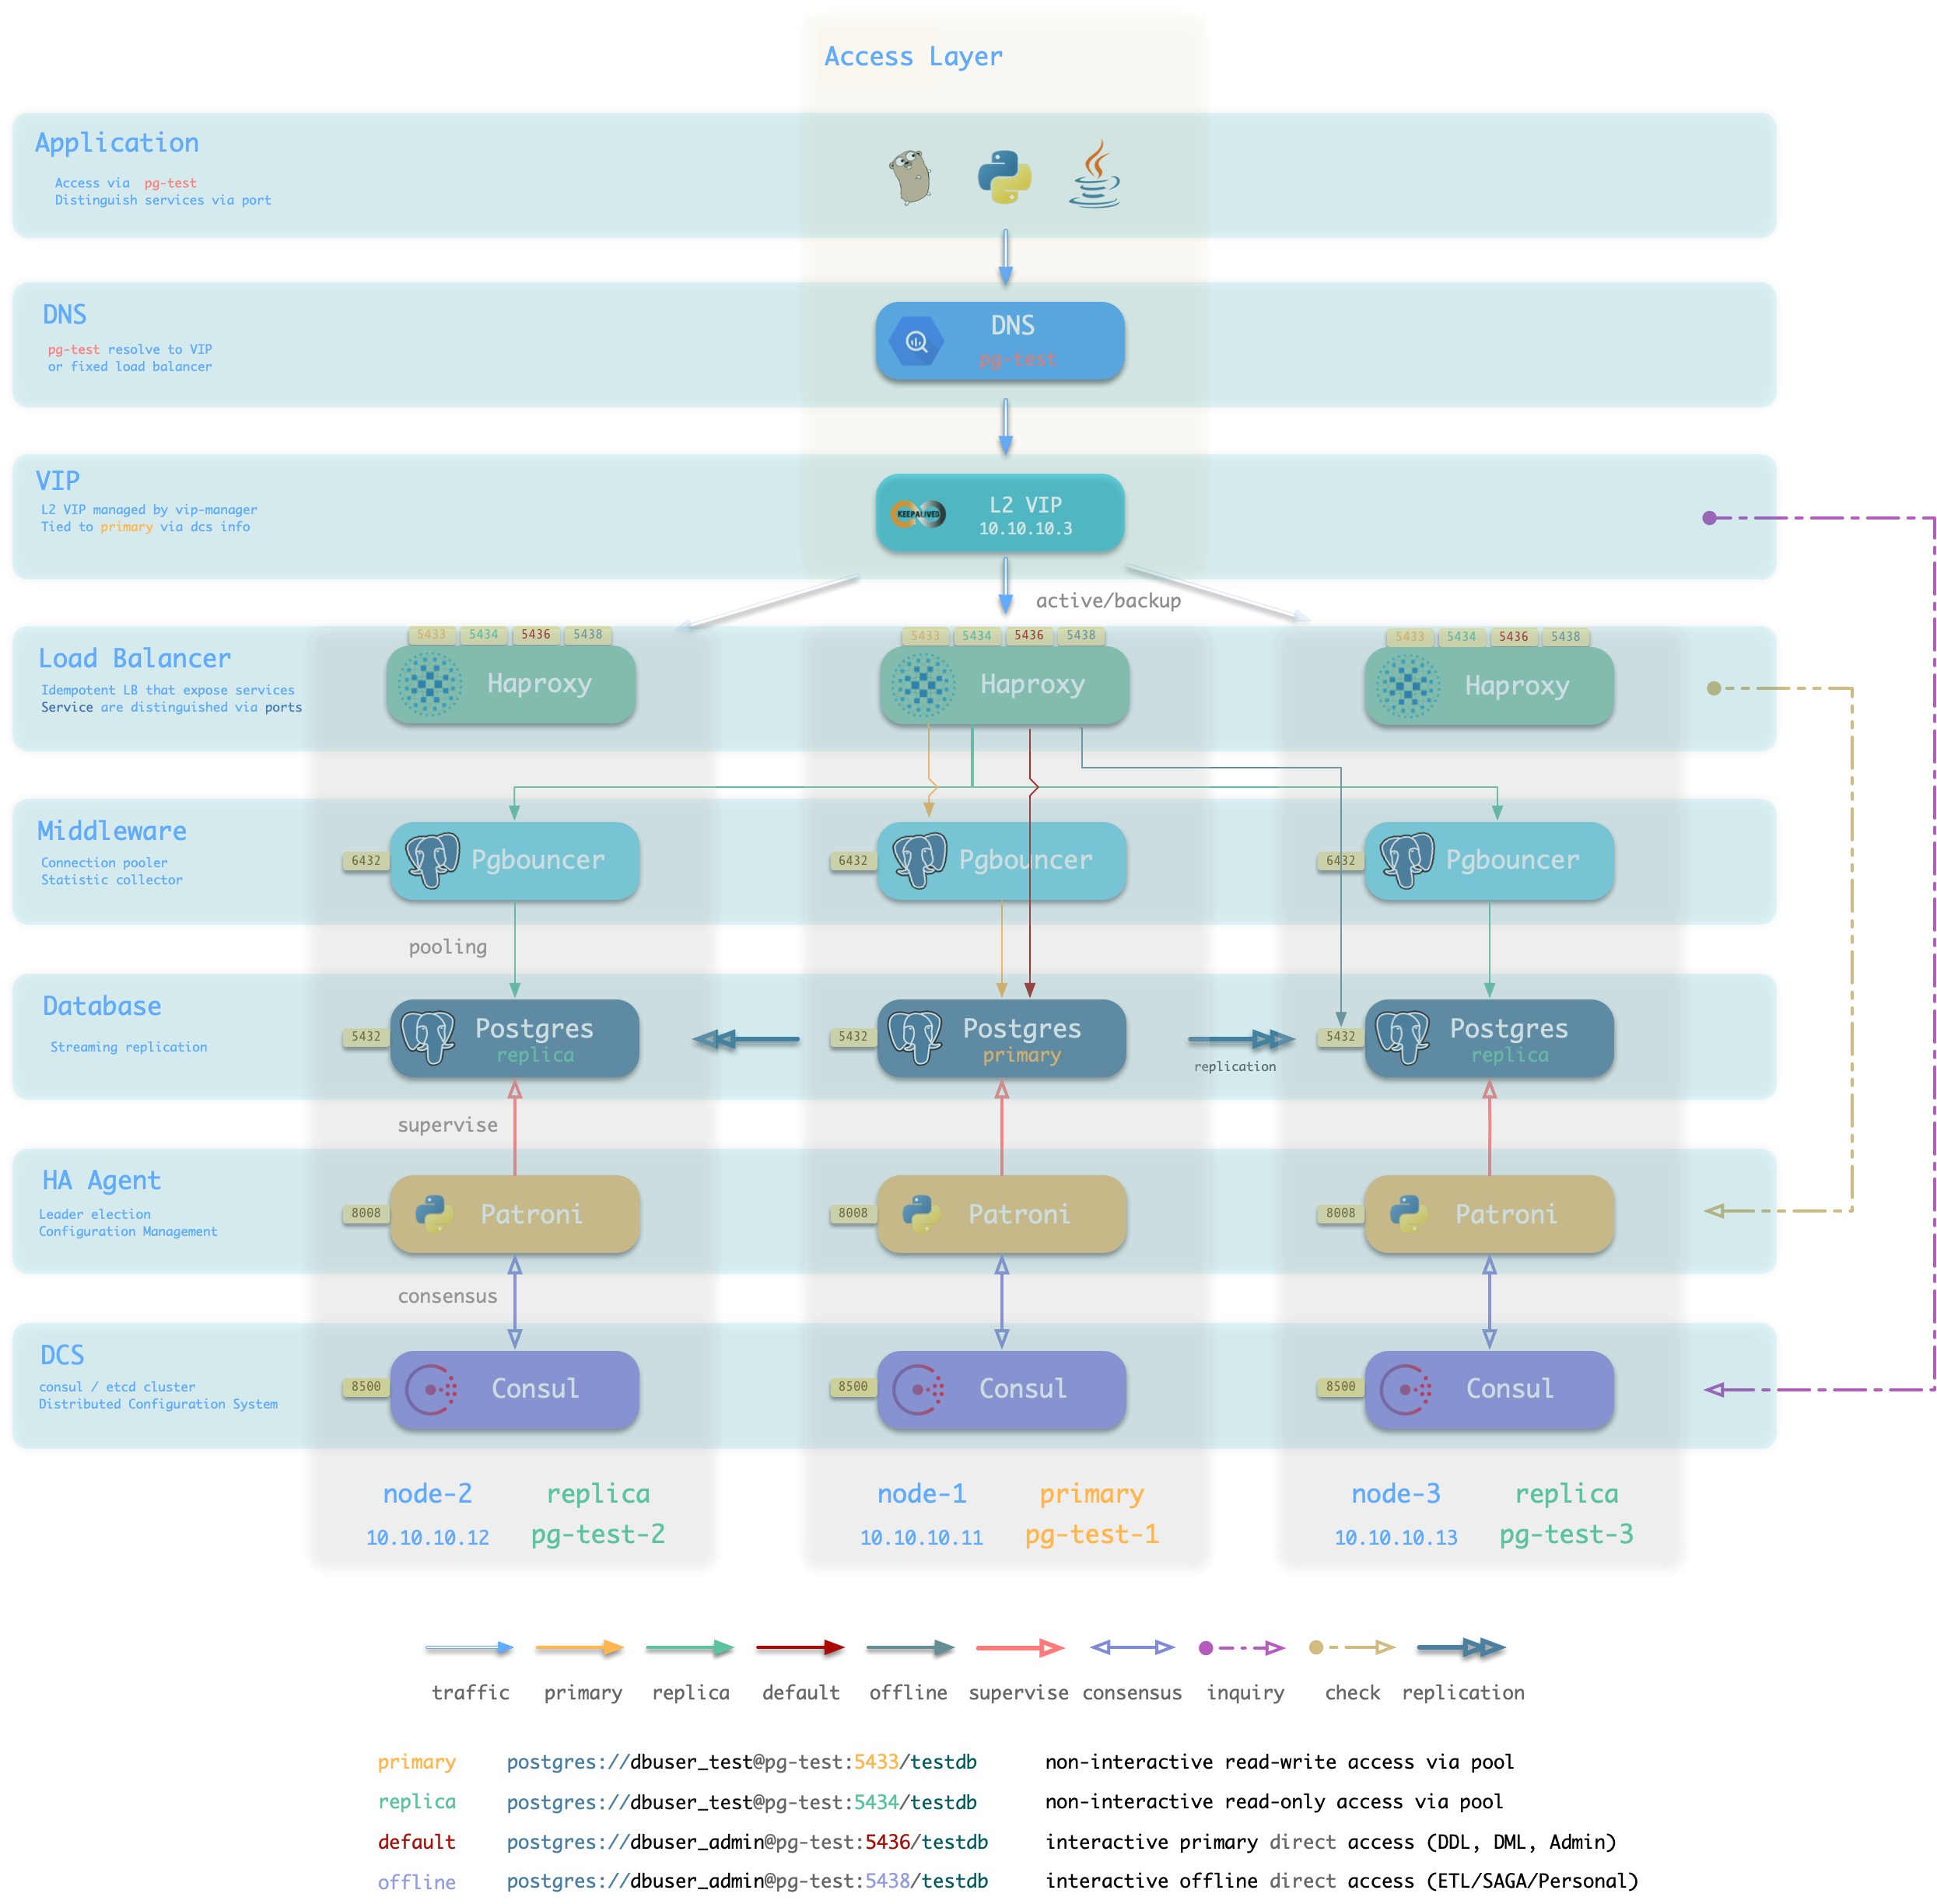
At the cluster level, users can access the [four default services] provided by the cluster via cluster domain + service port (. /service#default services), which Pigsty strongly recommends. Of course users can also bypass the domain name and access the database cluster directly using the cluster’s VIP (L2 or L4).
At the instance level, users can connect directly to the Postgres database via the node IP/domain name + port 5432, or they can use port 6432 to access the database via Pgbouncer. Services provided by the cluster to which the instance belongs can also be accessed via Haproxy via 5433~543x.
How the database is accessed ultimately depends on the traffic access scheme used by the database.
Typical access scheme
Pigsty recommends using a Haproxy-based access scheme (1/2), or in production environments with infrastructure support, an L4VIP (or equivalent load balancing service) based access scheme (3) can be used.
DNS + Haproxy
方案简介
标准高可用接入方案,系统无单点。灵活性,适用性,性能的最佳平衡点。
集群中的Haproxy采用Node Port的方式统一对外暴露 服务。每个Haproxy都是幂等的实例,提供完整的负载均衡与服务分发功能。Haproxy部署于每一个数据库节点上,因此整个集群的每一个成员在使用效果上都是幂等的。(例如访问任何一个成员的5433端口都会连接至主库连接池,访问任意成员的5434端口都会连接至某个从库的连接池)
Haproxy本身的可用性通过幂等副本实现,每一个Haproxy都可以作为访问入口,用户可以使用一个、两个、多个,所有Haproxy实例,每一个Haproxy提供的功能都是完全相同的。
用户需要自行确保应用能够访问到任意一个健康的Haproxy实例。作为最朴素的一种实现,用户可以将数据库集群的DNS域名解析至若干Haproxy实例,并启用DNS轮询响应。而客户端可以选择完全不缓存DNS,或者使用长连接并实现建立连接失败后重试的机制。又或者参考方案2,在架构侧通过额外的L2/L4 VIP确保Haproxy本身的高可用。
方案优越性
-
无单点,高可用
-
VIP固定绑定至主库,可以灵活访问
方案局限性
-
多一跳
-
Client IP地址丢失,部分HBA策略无法正常生效
-
Haproxy本身的高可用通过幂等副本,DNS轮询与客户端重连实现
DNS应有轮询机制,客户端应当使用长连接,并有建连失败重试机制。以便单Haproxy故障时可以自动漂移至集群中的其他Haproxy实例。如果无法做到这一点,可以考虑使用接入方案2,使用L2/L4 VIP确保Haproxy高可用。
方案示意
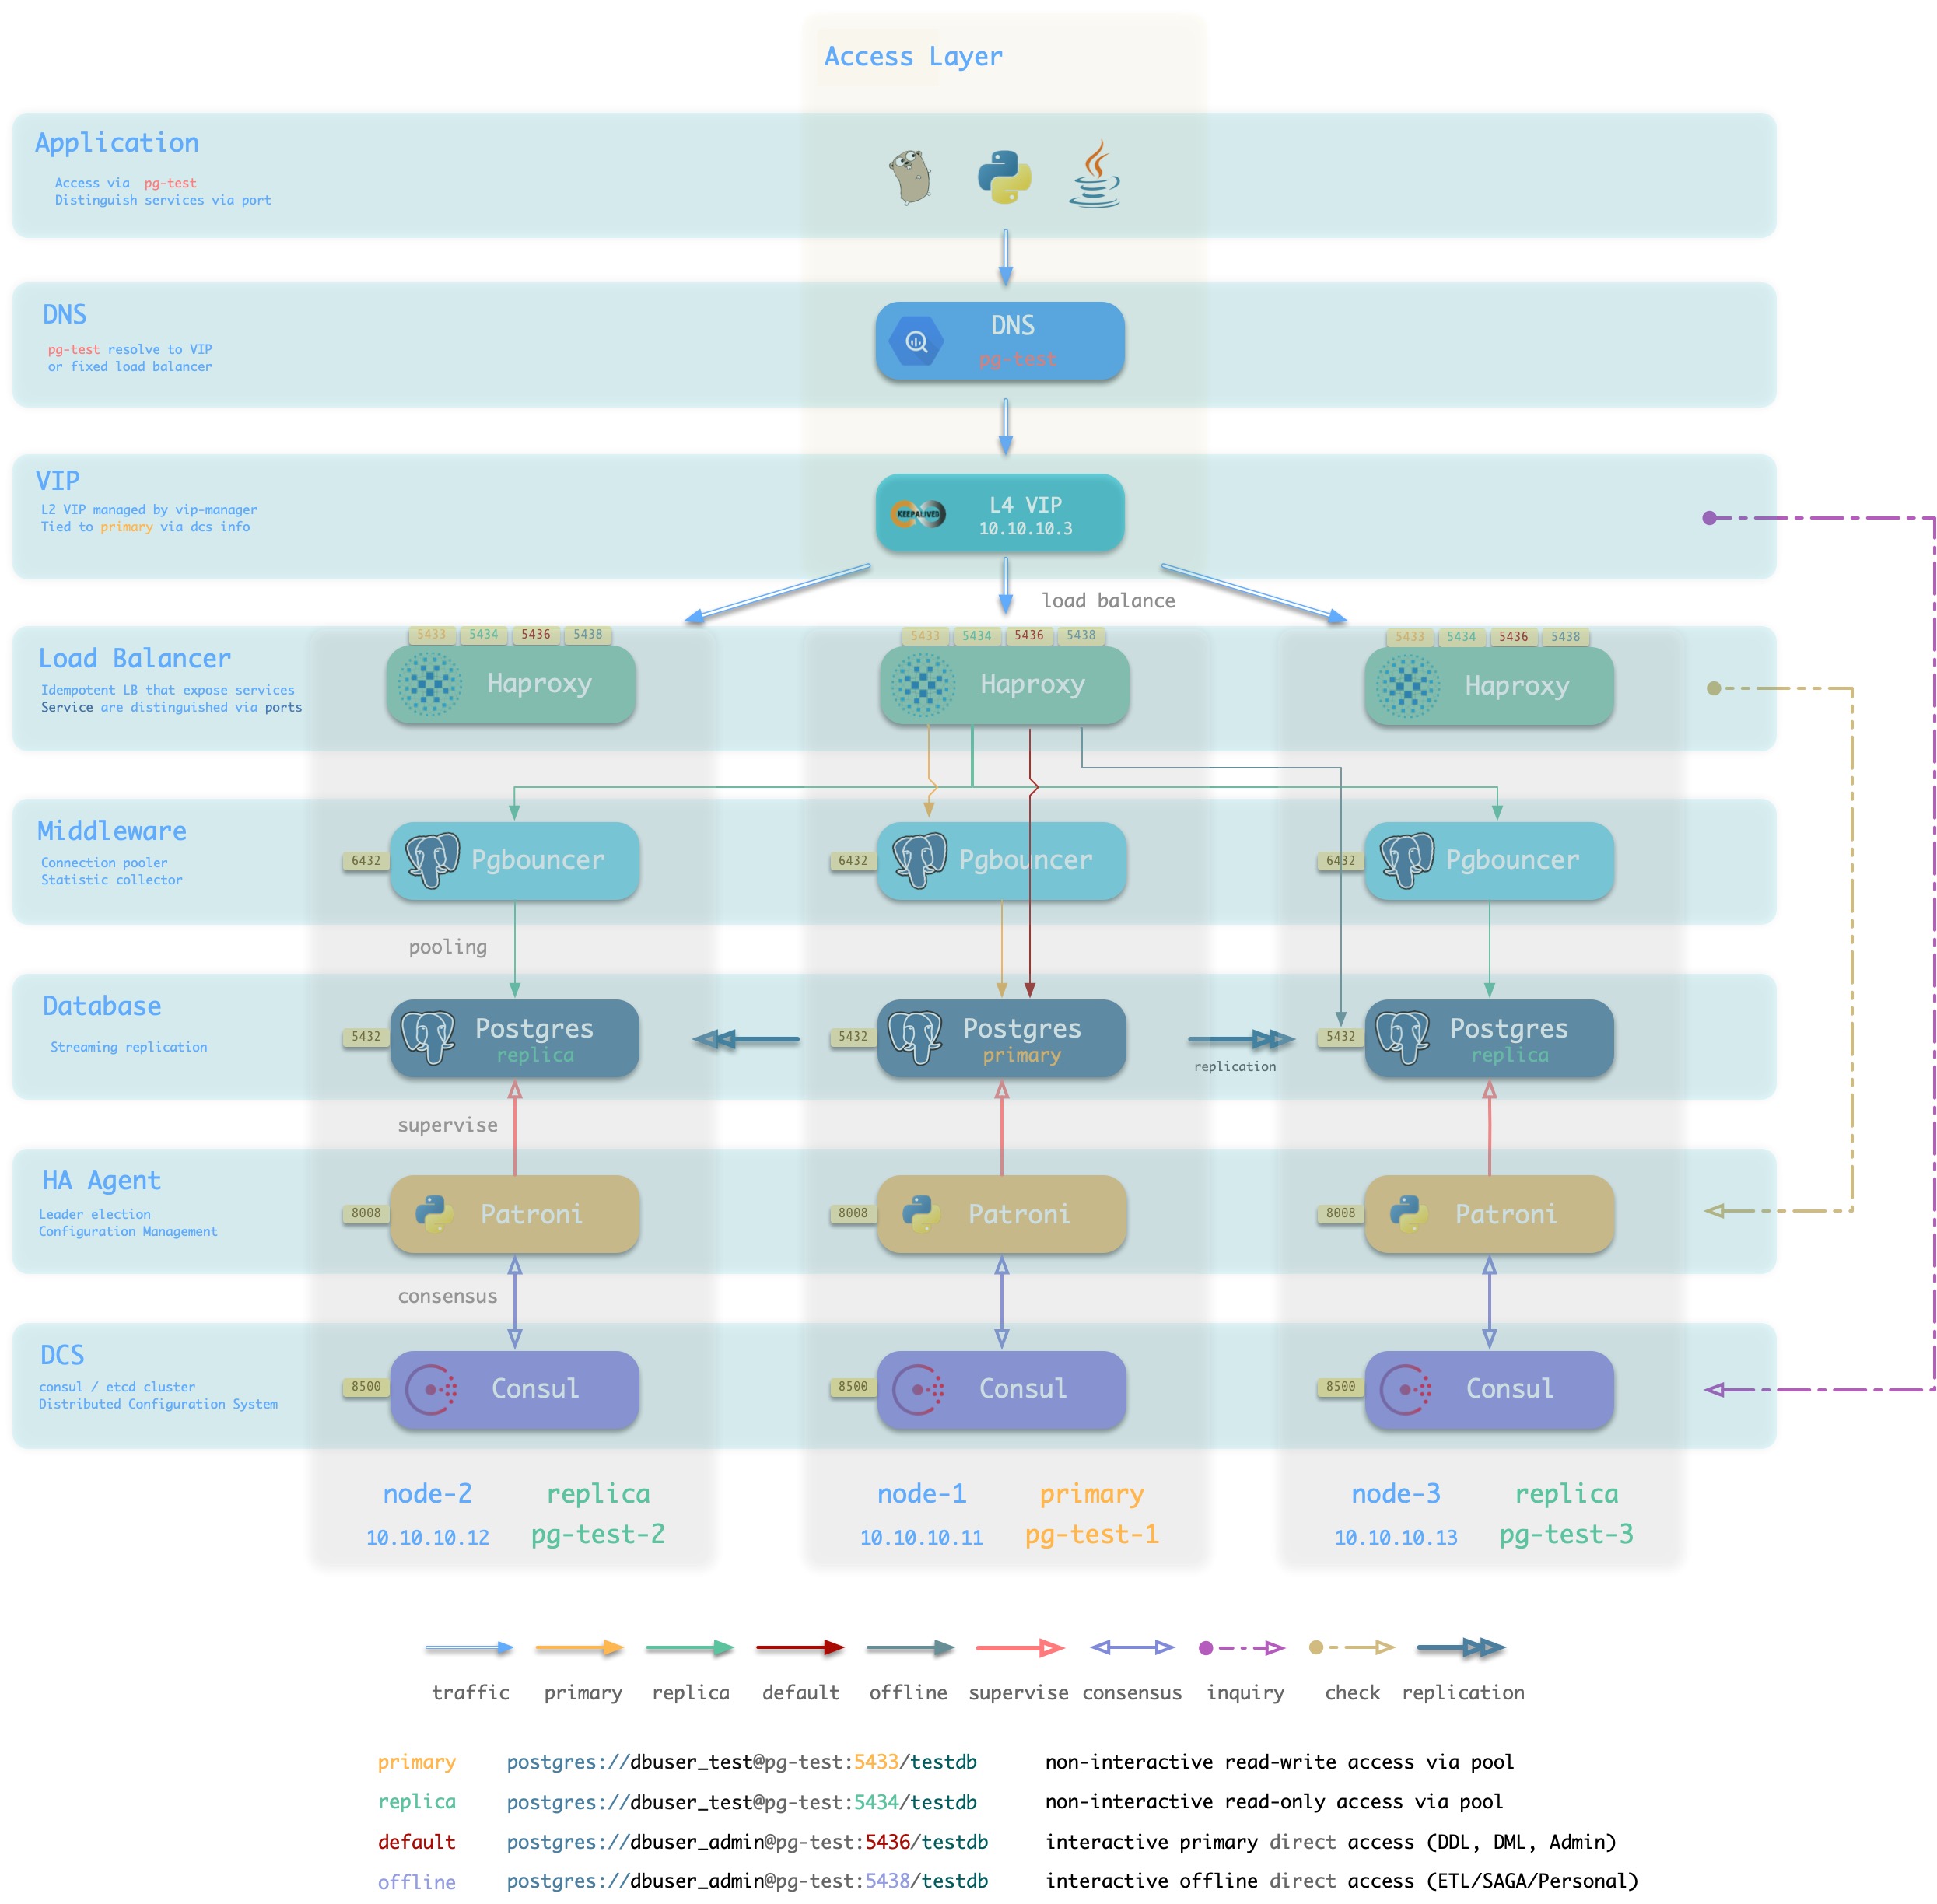
L2 VIP + Haproxy
方案简介
Pigsty沙箱使用的标准接入方案,采用单个域名绑定至单个L2 VIP,VIP指向集群中的HAProxy。
集群中的Haproxy采用Node Port的方式统一对外暴露 服务。每个Haproxy都是幂等的实例,提供完整的负载均衡与服务分发功能。而Haproxy本身的可用性则通过L2 VIP来保证。
每个集群都分配有一个L2 VIP,固定绑定至集群主库。当主库发生切换时,该L2 VIP也会随之漂移至新的主库上。这是通过vip-manager实现的:vip-manager会查询Consul获取集群当前主库信息,然后在主库上监听VIP地址。
集群的L2 VIP有与之对应的域名。域名固定解析至该L2 VIP,在生命周期中不发生变化。
方案优越性
-
无单点,高可用
-
VIP固定绑定至主库,可以灵活访问
方案局限性
方案示意
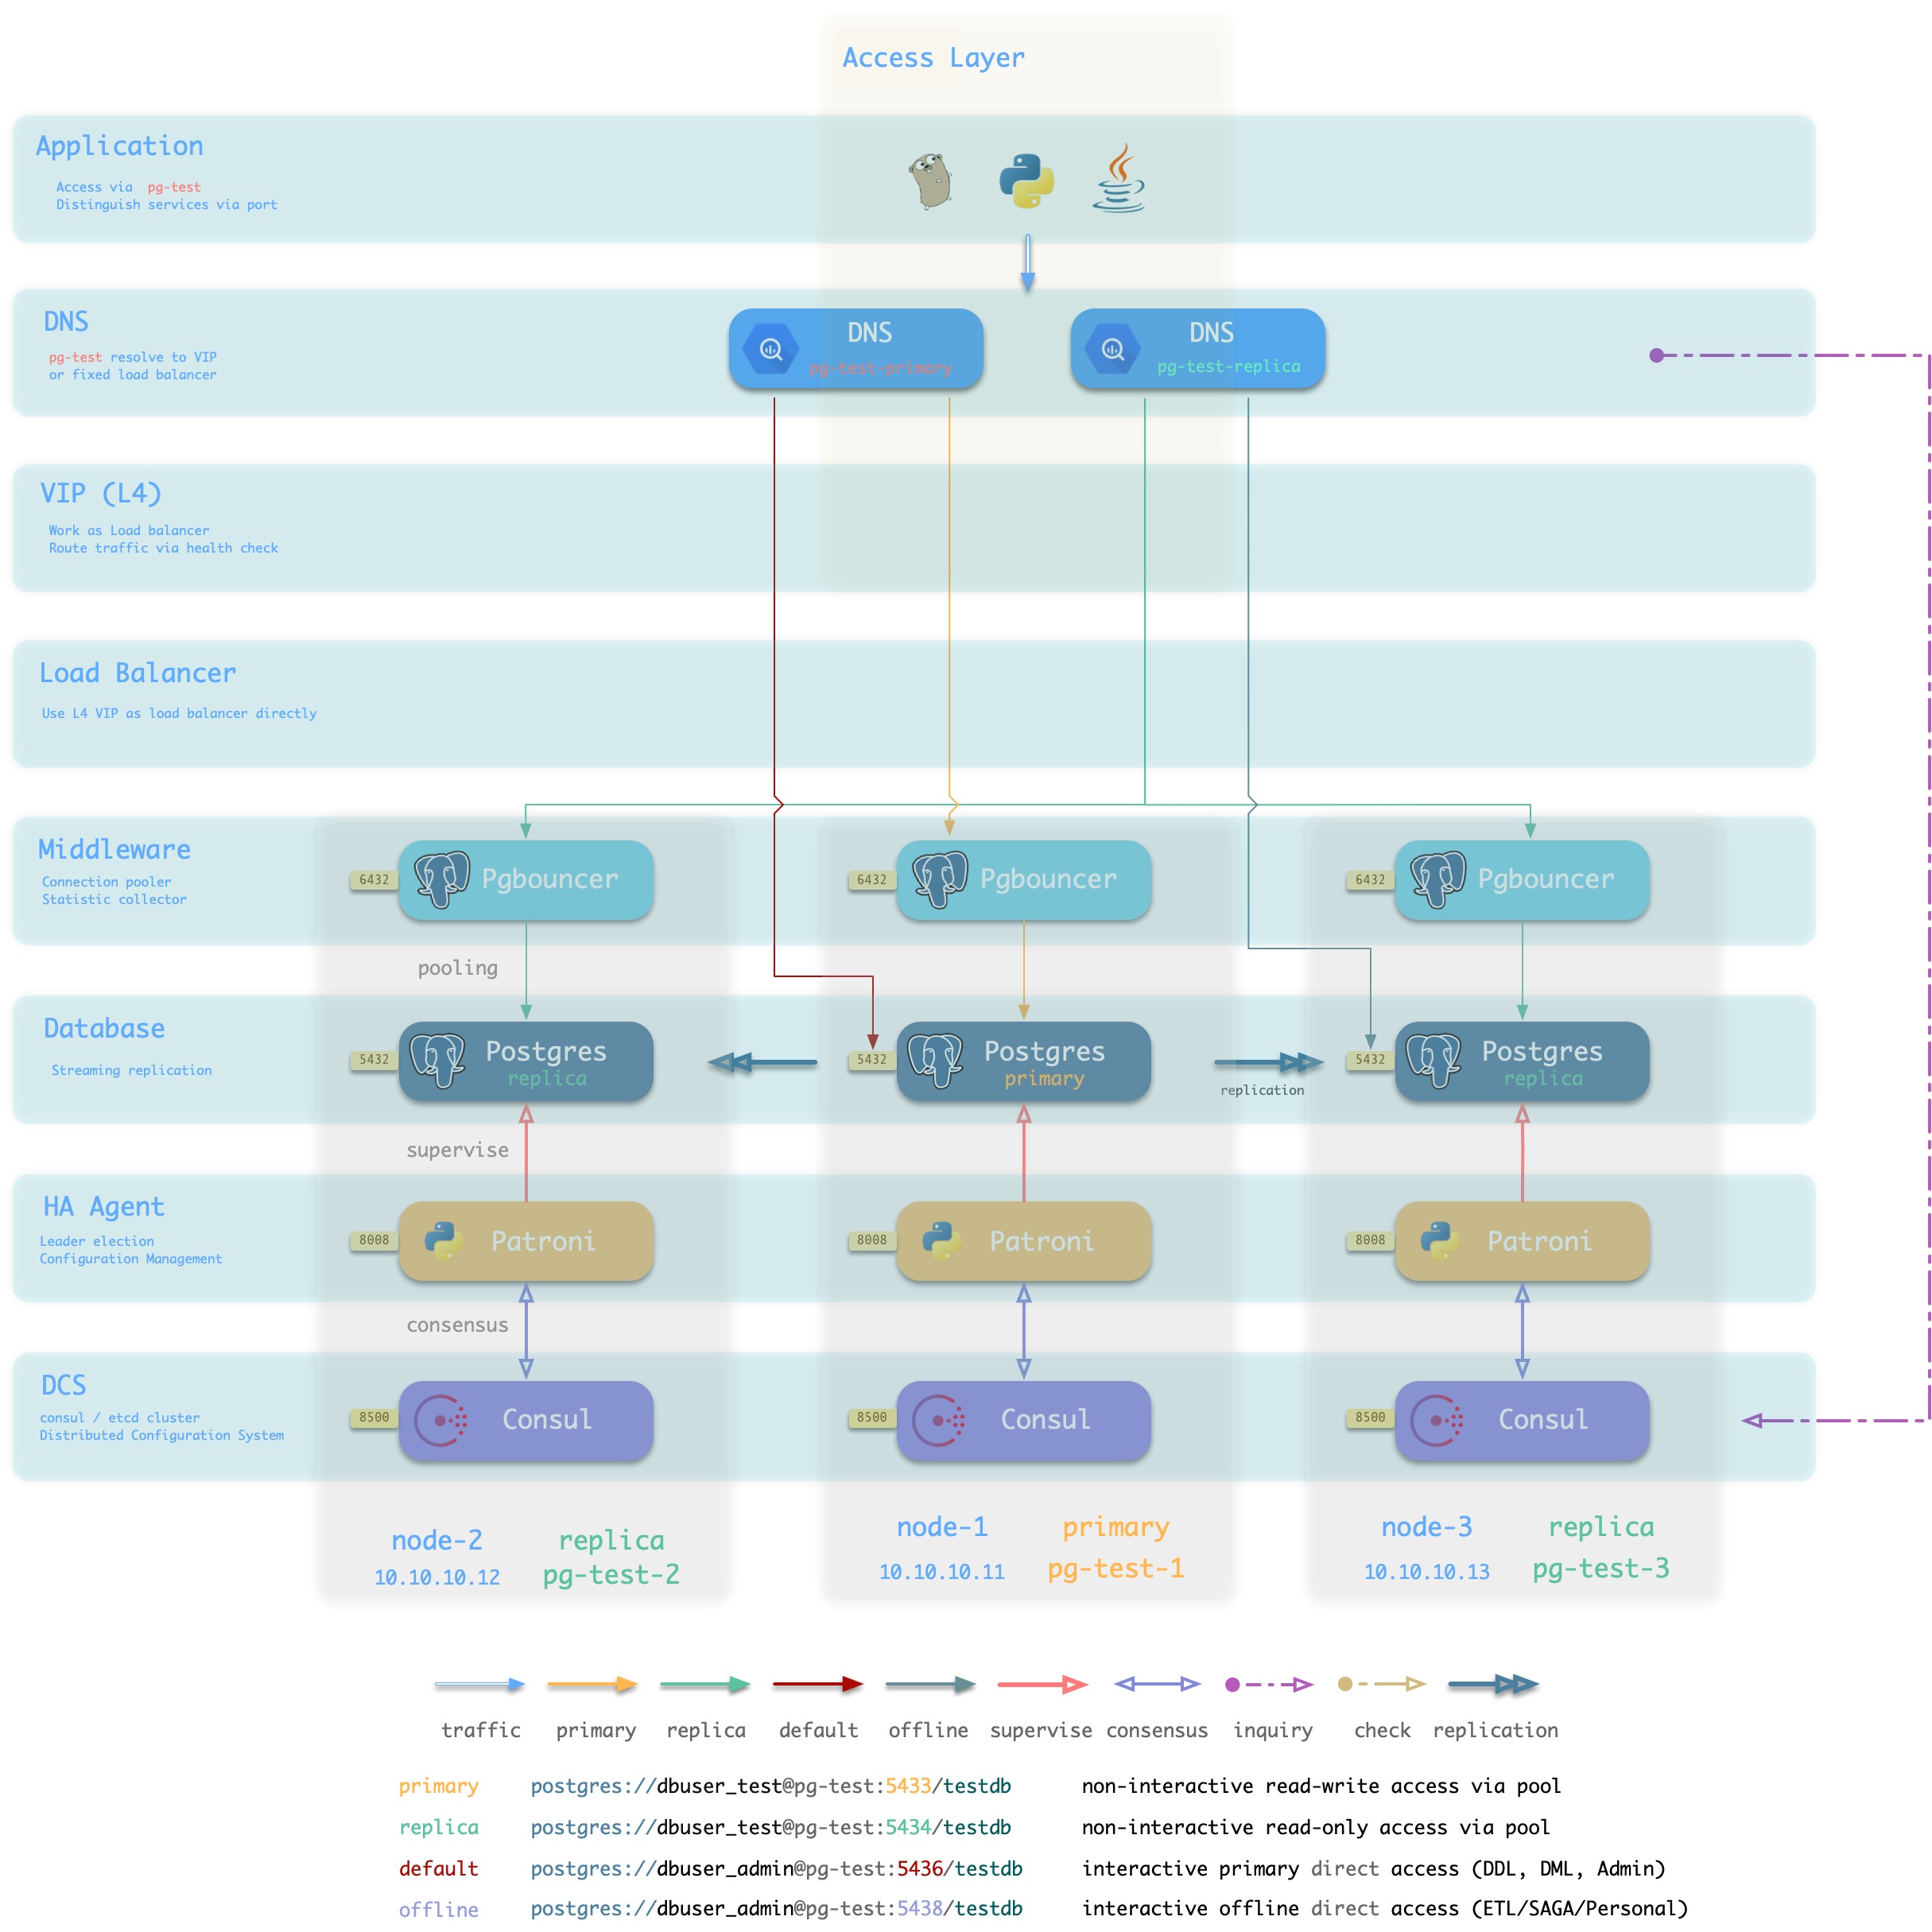
L4 VIP + Haproxy
方案简介
接入方案1/2的另一种变体,通过L4 VIP确保Haproxy的高可用
方案优越性
- 无单点,高可用
- 可以同时使用所有的Haproxy实例,均匀承载流量。
- 所有候选主库不需要位于同一二层网络。
- 可以操作单一VIP完成流量切换(如果同时使用了多个Haproxy,不需要逐个调整)
方案局限性
- 多两跳,较为浪费,如果有条件可以直接使用方案4: L4 VIP直接接入。
- Client IP地址丢失,部分HBA策略无法正常生效
方案示意
L4 VIP
方案简介
大规模高性能生产环境建议使用 L4 VIP接入(FullNAT,DPVS)
方案优越性
- 性能好,吞吐量大
- 可以通过
toa模块获取正确的客户端IP地址,HBA可以完整生效。
方案局限性
- 仍然多一条。
- 需要依赖外部基础设施,部署复杂。
- 未启用
toa内核模块时,仍然会丢失客户端IP地址。
- 没有Haproxy屏蔽主从差异,集群中的每个节点不再“幂等”。
方案示意

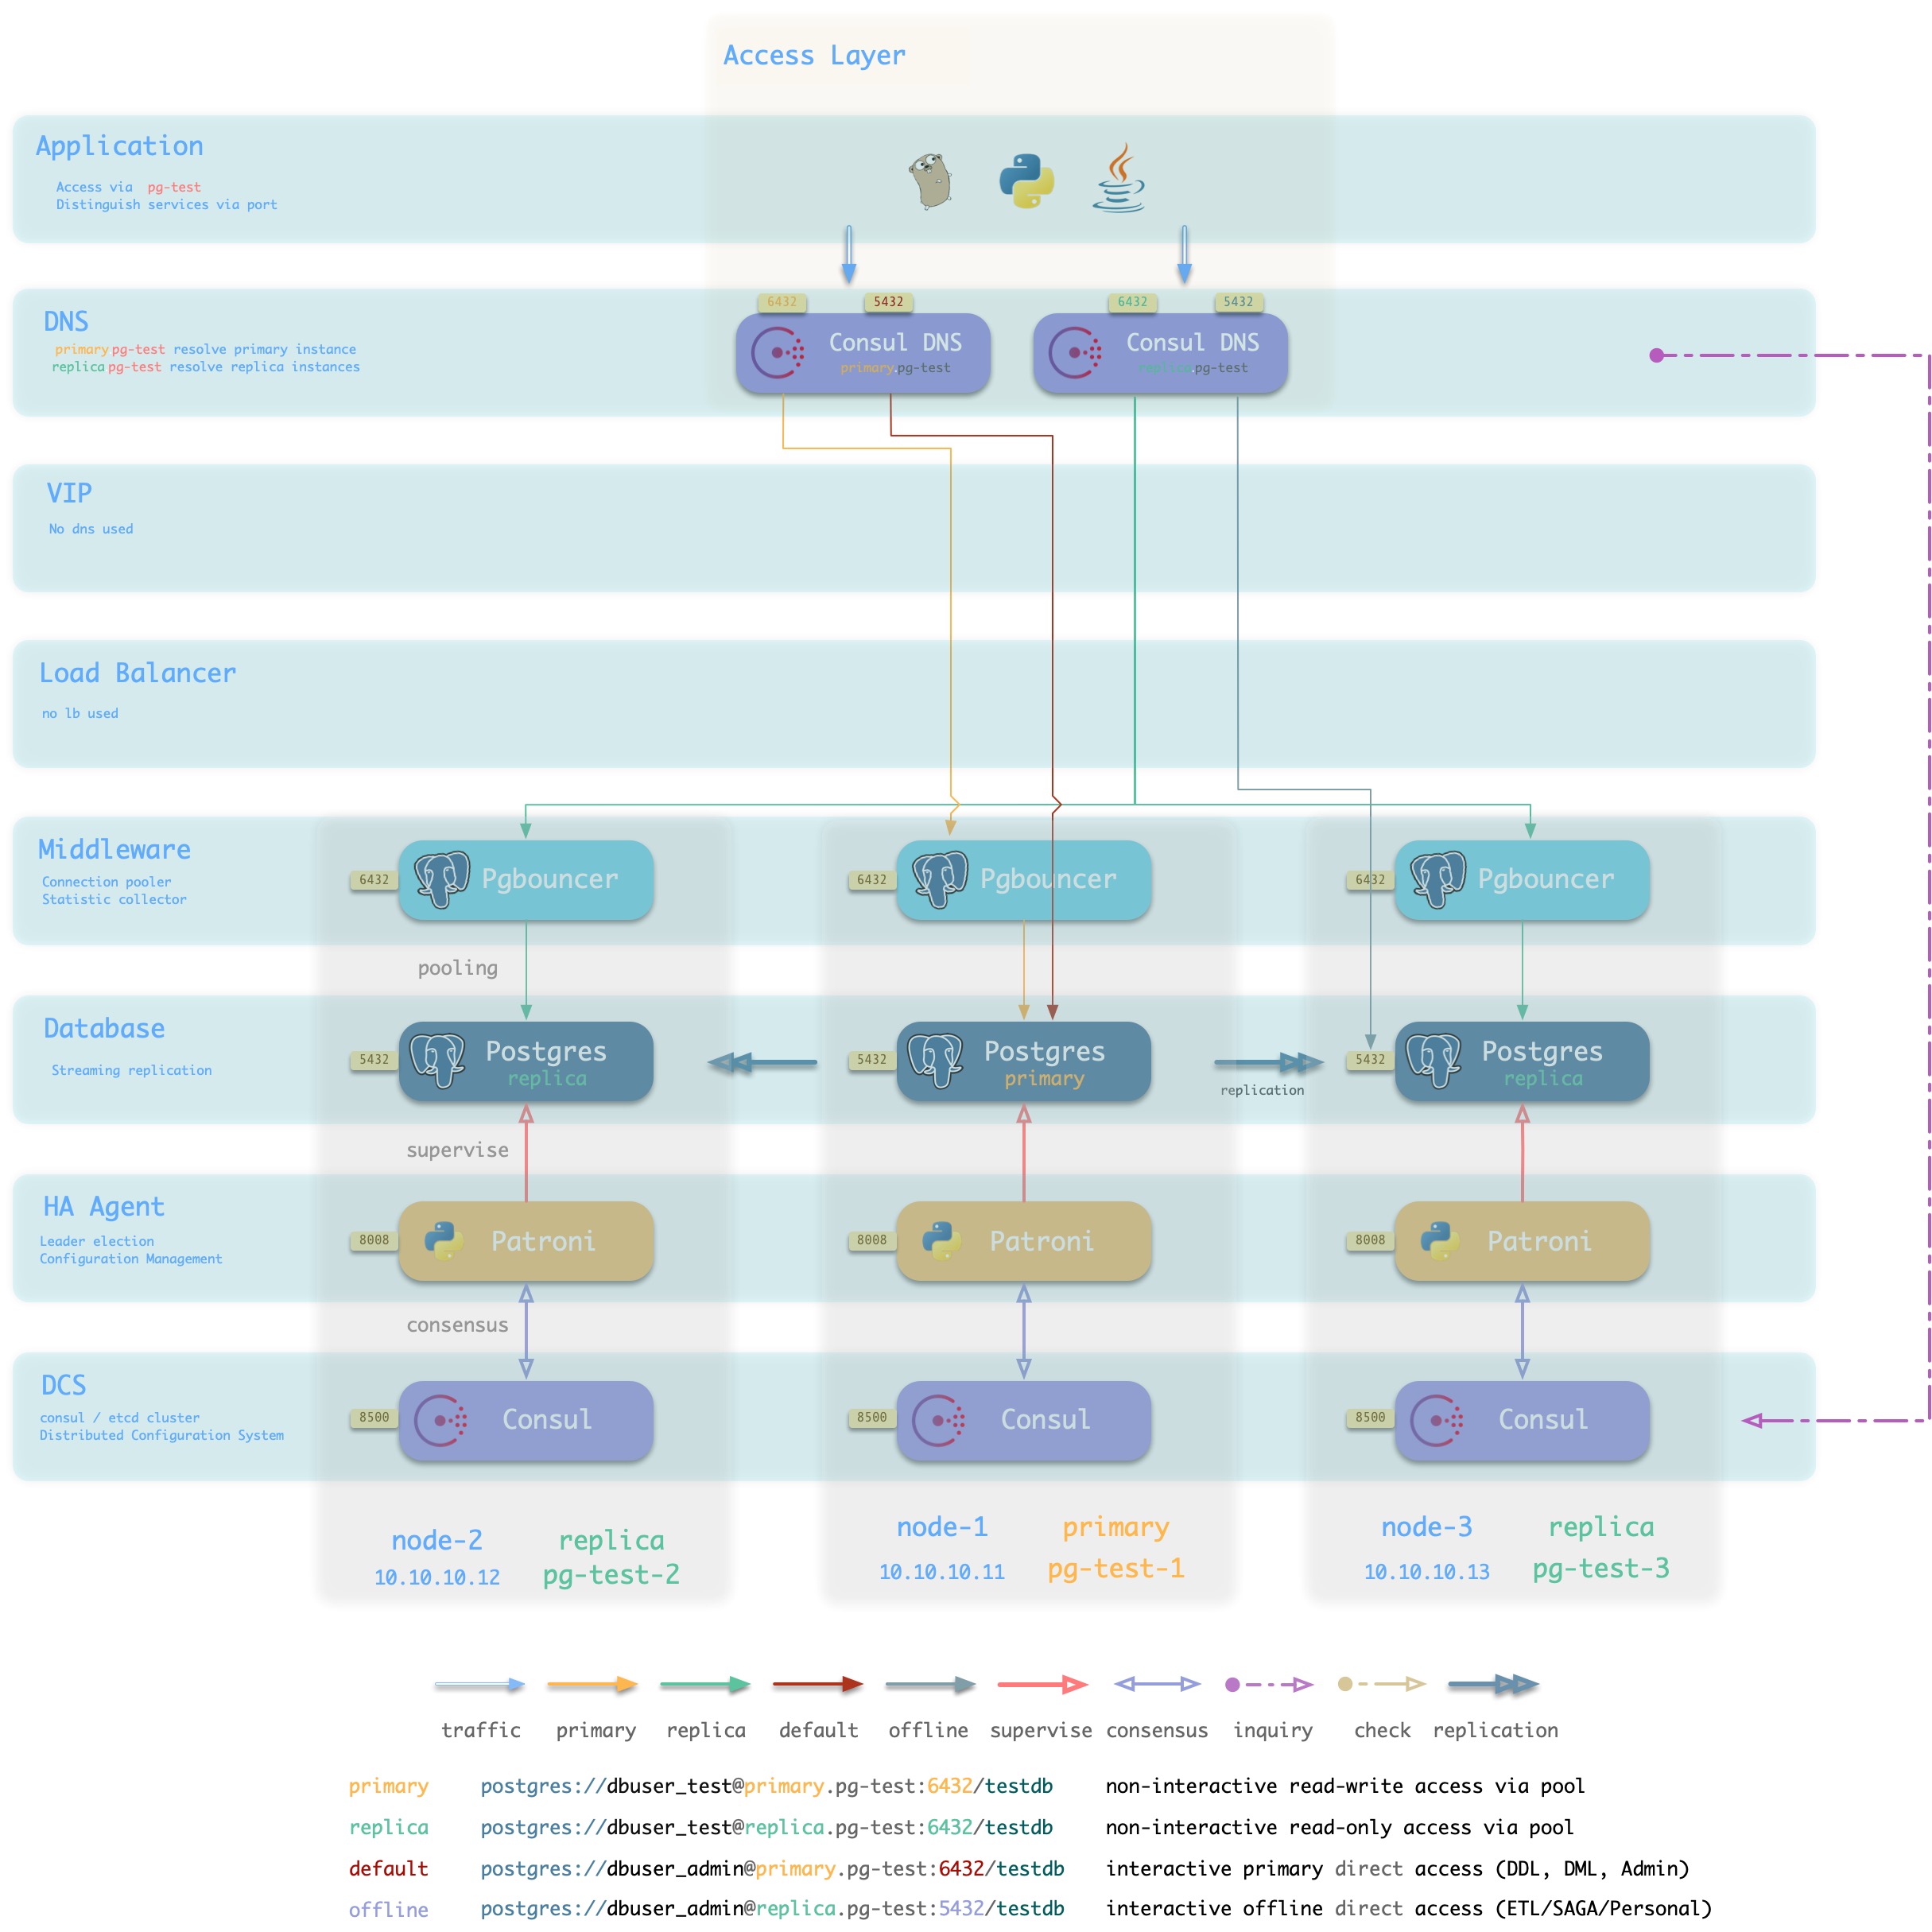
Consul DNS
方案简介
L2 VIP并非总是可用,特别是所有候选主库必须位于同一二层网络的要求可能不一定能满足。
在这种情况下,可以使用DNS解析代替L2 VIP,进行
方案优越性
方案局限性
- 依赖Consul DNS
- 用户需要合理配置DNS缓存策略
方案示意
Static DNS
方案简介
传统静态DNS接入方式
方案优越性
方案局限性
方案示意
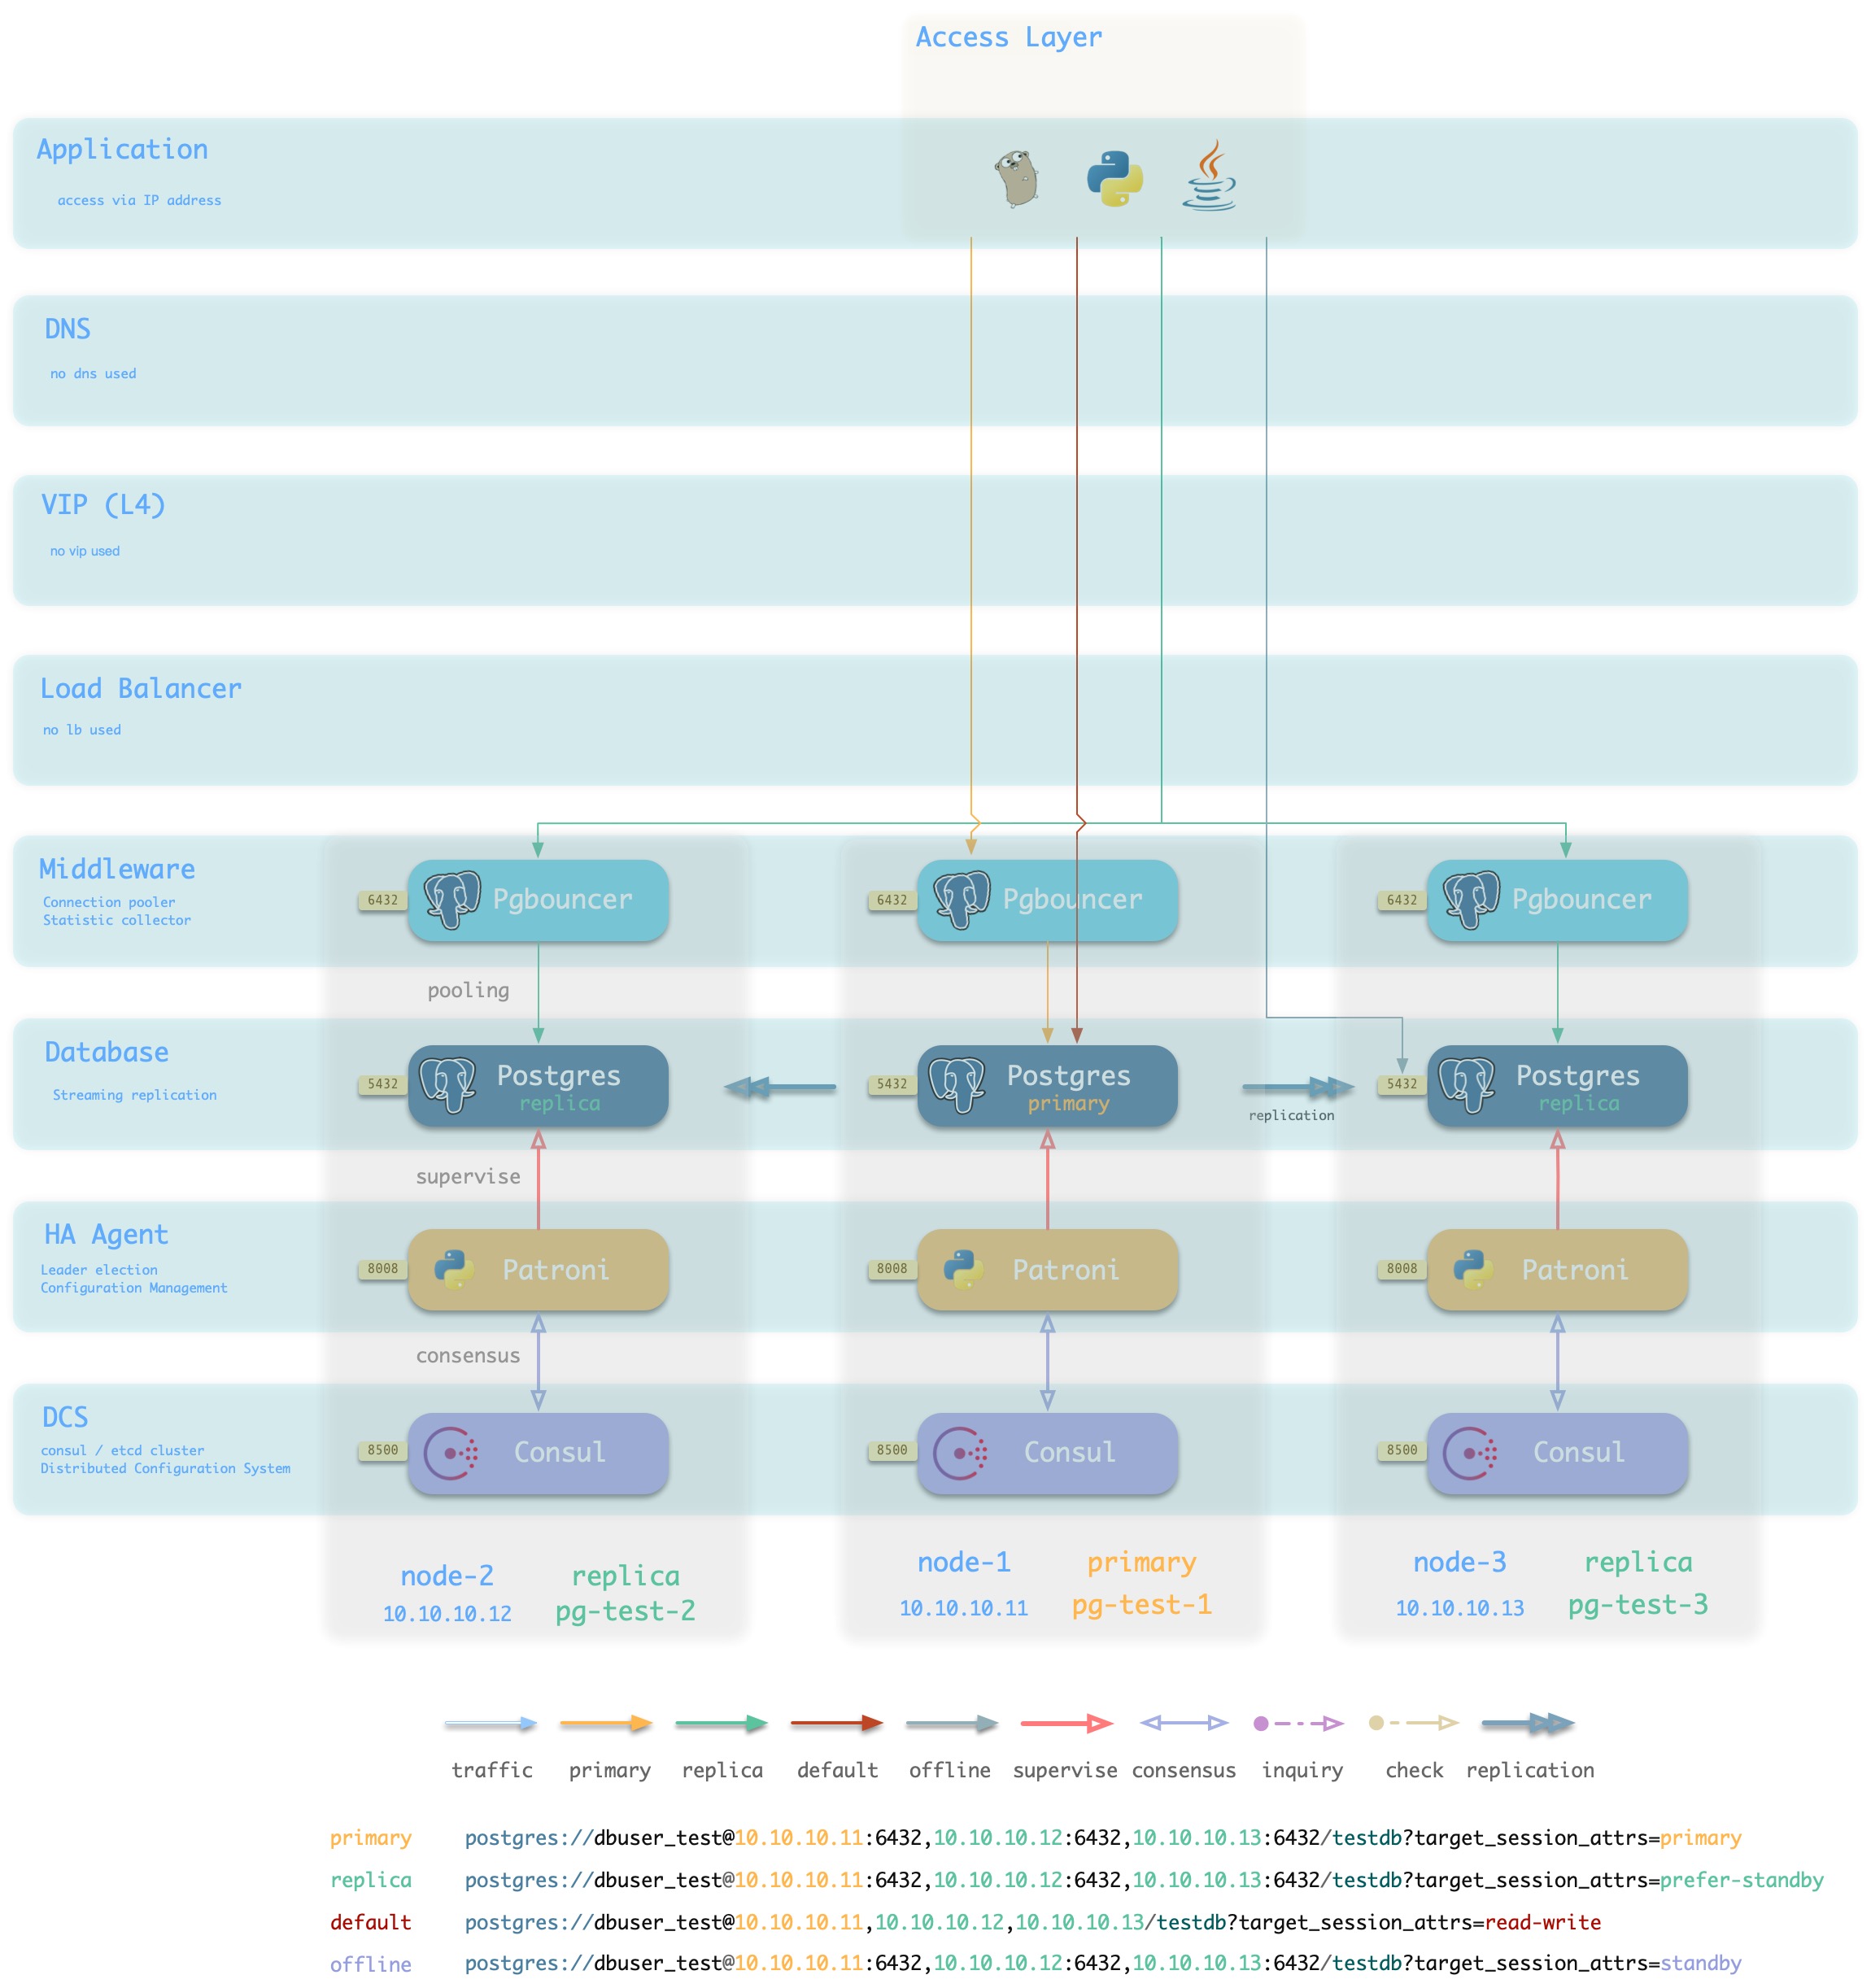
IP
方案简介
采用智能客户端直连数据库IP接入
方案优越性
- 直连数据库/连接池,少一条
- 不依赖额外组件进行主从区分,降低系统复杂性。
方案局限性
方案示意
4.2 - DB Service
How to access pigsty default service?
Service, the form of functionality that a database cluster provides to the outside world. In general, a database cluster** should provide at least two types of services**.
- read-write service (primary): users can write to the database
- read-only service (replica): users can access read-only copies
In addition, depending on the specific business scenario, there may be other services.
- offline replica service (offline): a dedicated slave that does not take on online read-only traffic, used for ETL and individual user queries.
- synchronous replica service (standby): read-only service with synchronous commit and no replication delay.
- delayed : Allows services to access old data before a fixed time interval.
- default : A service that allows (administrative) users to manage the database directly, bypassing the connection pool
Default Service
Pigsty provides four services outside the default queue: primary, replica, default, offline.
| service |
port |
purpose |
description |
| primary |
5433 |
production read/write |
connect to cluster primary via connection pool |
| replica |
5434 |
production read-only |
connection to cluster slave via connection pool |
| default |
5436 |
management |
direct connection to cluster master |
| offline |
5438 |
ETL/personal user |
connects directly to an available offline instance of the cluster |
| service |
port |
description |
sample |
| primary |
5433 |
Only production users can connect |
postgres://test@pg-test:5433/test |
| replica |
5434 |
Only production users can connect |
postgres://test@pg-test:5434/test |
| default |
5436 |
Administrator and DML executor can connect |
postgres://dbuser_admin@pg-test:5436/test |
| offline |
5438 |
ETL/STATS Individual users can connect |
postgres://dbuser_stats@pg-test-tt:5438/test
postgres://dbp_vonng@pg-test:5438/test |
Primary Service
The Primary service serves online production read and write access, which maps the cluster’s port 5433, to the primary connection pool (default 6432) port.
The Primary service selects all instances in the cluster as its members, but only those with a true health check /primary can actually take on traffic.
There is one and only one instance in the cluster that is the primary, and only its health check is true.
- name: primary           # service name {{ pg_cluster }}_primary
  src_ip: "*"
  src_port: 5433
  dst_port: pgbouncer     # 5433 route to pgbouncer
  check_url: /primary     # primary health check, success when instance is primary
  selector: "[]"          # select all instance as primary service candidate
Replica Service
The Replica service serves online production read-only access, which maps the cluster’s port 5434, to the slave connection pool (default 6432) port.
The Replica service selects all instances in the cluster as its members, but only those with a true health check /read-only can actually take on traffic, and that health check returns success for all instances (including the master) that can take on read-only traffic. So any member of the cluster can carry read-only traffic.
But by default, only slave libraries carry read-only requests. The Replica service defines selector_backup, a selector that adds the cluster’s master library to the Replica service as a backup instance. The master will start taking read-only traffic** only when all other instances in the Replica service, i.e. **all slaves, are down.
# replica service will route {ip|name}:5434 to replica pgbouncer (5434->6432 ro)
- name: replica           # service name {{ pg_cluster }}_replica
  src_ip: "*"
  src_port: 5434
  dst_port: pgbouncer
  check_url: /read-only   # read-only health check. (including primary)
  selector: "[]"          # select all instance as replica service candidate
  selector_backup: "[? pg_role == `primary`]"   # primary are used as backup server in replica service
Default Service
The Default service serves the online primary direct connection, which maps the cluster’s port 5436, to the primary Postgres port (default 5432).
The Default service targets interactive read and write access, including: executing administrative commands, executing DDL changes, connecting to the primary library to execute DML, and executing CDC. interactive operations should not be accessed through connection pools, so the Default service forwards traffic directly to Postgres, bypassing the Pgbouncer.
The Default service is similar to the Primary service, using the same configuration options. The Default parameters are filled in explicitly for demonstration purposes.
# default service will route {ip|name}:5436 to primary postgres (5436->5432 primary)
- name: default           # service's actual name is {{ pg_cluster }}-{{ service.name }}
  src_ip: "*"             # service bind ip address, * for all, vip for cluster virtual ip address
  src_port: 5436          # bind port, mandatory
  dst_port: postgres      # target port: postgres|pgbouncer|port_number , pgbouncer(6432) by default
  check_method: http      # health check method: only http is available for now
  check_port: patroni     # health check port:  patroni|pg_exporter|port_number , patroni by default
  check_url: /primary     # health check url path, / as default
  check_code: 200         # health check http code, 200 as default
  selector: "[]"          # instance selector
  haproxy:                # haproxy specific fields
    maxconn: 3000         # default front-end connection
    balance: roundrobin   # load balance algorithm (roundrobin by default)
    default_server_options: 'inter 3s fastinter 1s downinter 5s rise 3 fall 3 on-marked-down shutdown-sessions slowstart 30s maxconn 3000 maxqueue 128 weight 100'
Offline Service
The Offline Service is used for offline access and personal queries. It maps the cluster’s 5438 port, to the offline instance Postgres port (default 5432).
The Offline Service is for interactive read-only access, including: ETL, offline large analytics queries, and individual user queries. Interactive operations should not be accessed through connection pools, so the Default service forwards traffic directly to the offline instance of Postgres, bypassing the Pgbouncer.
Offline instances are those with pg_role == offline or with the pg_offline_query flag. Other other slave libraries outside of the Offline instance will act as backup instances for Offline, so that when the Offline instance goes down, the Offline service can still get services from other slave libraries.
# offline service will route {ip|name}:5438 to offline postgres (5438->5432 offline)
- name: offline           # service name {{ pg_cluster }}_replica
  src_ip: "*"
  src_port: 5438
  dst_port: postgres
  check_url: /replica     # offline MUST be a replica
  selector: "[? pg_role == `offline` || pg_offline_query ]"         # instances with pg_role == 'offline' or instance marked with 'pg_offline_query == true'
  selector_backup: "[? pg_role == `replica` && !pg_offline_query]"  # replica are used as backup server in offline service
服务定义
Offline service is used for offline access and personal queries. It maps the cluster’s 5438 port, to the offline instance Postgres port (default 5432).
The Offline service is for interactive read-only access, including: ETL, offline large analytics queries, and individual user queries. Interactive operations should not be accessed through connection pools, so the Default service forwards traffic directly to the offline instance of Postgres, bypassing the Pgbouncer.
Offline instances are those with pg_role == offline or with the pg_offline_query flag. Other other slave libraries outside the Offline instance will act as backup instances for Offline, so that when the Offline instance goes down, the Offline service can still get services from other slave libraries.
# primary service will route {ip|name}:5433 to primary pgbouncer (5433->6432 rw)
- name: primary           # service name {{ pg_cluster }}_primary
  src_ip: "*"
  src_port: 5433
  dst_port: pgbouncer     # 5433 route to pgbouncer
  check_url: /primary     # primary health check, success when instance is primary
  selector: "[]"          # select all instance as primary service candidate

# replica service will route {ip|name}:5434 to replica pgbouncer (5434->6432 ro)
- name: replica           # service name {{ pg_cluster }}_replica
  src_ip: "*"
  src_port: 5434
  dst_port: pgbouncer
  check_url: /read-only   # read-only health check. (including primary)
  selector: "[]"          # select all instance as replica service candidate
  selector_backup: "[? pg_role == `primary`]"   # primary are used as backup server in replica service

# default service will route {ip|name}:5436 to primary postgres (5436->5432 primary)
- name: default           # service's actual name is {{ pg_cluster }}-{{ service.name }}
  src_ip: "*"             # service bind ip address, * for all, vip for cluster virtual ip address
  src_port: 5436          # bind port, mandatory
  dst_port: postgres      # target port: postgres|pgbouncer|port_number , pgbouncer(6432) by default
  check_method: http      # health check method: only http is available for now
  check_port: patroni     # health check port:  patroni|pg_exporter|port_number , patroni by default
  check_url: /primary     # health check url path, / as default
  check_code: 200         # health check http code, 200 as default
  selector: "[]"          # instance selector
  haproxy:                # haproxy specific fields
    maxconn: 3000         # default front-end connection
    balance: roundrobin   # load balance algorithm (roundrobin by default)
    default_server_options: 'inter 3s fastinter 1s downinter 5s rise 3 fall 3 on-marked-down shutdown-sessions slowstart 30s maxconn 3000 maxqueue 128 weight 100'

# offline service will route {ip|name}:5438 to offline postgres (5438->5432 offline)
- name: offline           # service name {{ pg_cluster }}_replica
  src_ip: "*"
  src_port: 5438
  dst_port: postgres
  check_url: /replica     # offline MUST be a replica
  selector: "[? pg_role == `offline` || pg_offline_query ]"         # instances with pg_role == 'offline' or instance marked with 'pg_offline_query == true'
  selector_backup: "[? pg_role == `replica` && !pg_offline_query]"  # replica are used as backup server in offline service
Mandatory
-
Name (service.name).
service name, the full name of the service is prefixed by the database cluster name and suffixed by service.name, connected by -. For example, a service with name=primary in the pg-test cluster has the full service name pg-test-primary.
-
Port (service.port).
In Pigsty, services are exposed to the public by default in the form of NodePort, so exposing the port is mandatory. However, if you use an external load balancing service access scheme, you can also distinguish the services in other ways.
-
selector (service.selector).
The selector specifies the instance members of the service, in the form of a JMESPath that filters variables from all cluster instance members. The default [] selector will pick all cluster members.
Optional
-
backup selector (service.selector).
Optional backup selector service.selector_backup will select or mark the list of instances used for service backup, i.e. the backup instance takes over the service only when all other members of the cluster fail. For example, the primary instance can be added to the alternate set of the replica service, so that the master can still carry the read-only traffic of the cluster when all the slaves fail.
-
source_ip (service.src_ip).
Indicates the IP address used externally by the service. The default is *, which is all IP addresses on the local machine. Using vip will use the vip_address variable to take the value, or you can also fill in the specific IP address supported by the NIC.
-
Host port (service.dst_port).
Which port on the target instance will the service’s traffic be directed to? postgres will point to the port that the database listens on, pgbouncer will point to the port that the connection pool listens on, or you can fill in a fixed port number.
-
health check method (service.check_method):
How does the service check the health status of the instance? Currently only HTTP is supported
-
Health check port (service.check_port):
Which port does the service check the instance on to get the health status of the instance? patroni will get it from Patroni (default 8008), pg_exporter will get it from PG Exporter (default 9630), or user can fill in a custom port number.
-
Health check path (service.check_url):
The URL PATH used by the service to perform HTTP checks. / is used by default for health checks, and PG Exporter and Patroni provide a variety of health check methods that can be used to differentiate between master and slave traffic. For example, /primary will only return success for the master, and /replica will only return success for the slave. /read-only, on the other hand, will return success for any instance that supports read-only (including the master).
-
health check code (service.check_code):
The code expected for HTTP health checks, default is 200
-
Haproxy-specific configuration (service.haproxy) :
Proprietary configuration items about the service provisioning software (HAproxy)
4.3 - HA
Introduction to High Availability
The database cluster created by Pigsty is a distributed, highly available database cluster.
Effectively, as long as any instance in the cluster survives, the cluster can provide complete read and write services and read-only services to the outside world.
Each database instance in the database cluster is idempotent in use, and any instance can provide complete read and write services through the built-in load balancing components.
Database clusters can automatically perform fault detection and master-slave switching, and common failures can self-heal within seconds to tens of seconds, and read-only traffic is not affected during this period.
High Availability
Two core scenarios: Switchover, Failover
Four core issues: Fault detection, Fencing, master selection, traffic switching
For a walkthrough of the core scenarios of high availability, please refer to [High Availability Walkthrough](… /… /… /tasks/ha-drill/) section.
Patroni-based high availability scenarios
The Patroni based high availability solution is simple to deploy, does not require the use of special hardware, and has a large number of real production use cases to back it up.
Pigsty’s high availability solution is based on Patroni, vip-manager, haproxy
Patroni is based on DCS (etcd/consul/zookeeper) to reach a master selection consensus.
Patroni’s failure detection uses heartbeat packet to keep alive, DCS lease mechanism to achieve. The main repository holds the lease, and if Qin loses its deer, the world will fight it.
Patroni’s Fencing is based on the Linux kernel module watchdog.
Patroni provides master-slave health checks for easy integration with external load balancers.
Haproxy and VIP based access layer solutions
Pigsty sandboxes use by default L2 VIP and Haproxy based access layer solutions, Pigsty provides several optional [database access](… /… /… /concept/provision/access/) methods.
!
Haproxy idempotently is deployed on each instance of the cluster, and any one or more Haproxy instances can act as a load balancer for the cluster.
Haproxy uses a Node Port-like approach to expose its services to the public. By default, port 5433 provides read and write services to the cluster, while port 5434 provides read-only services to the cluster.
High availability of Haproxy itself can be achieved in several ways.
- Using a smart client that connects to the database using the DNS or service discovery mechanism provided by Consul.
- Using a smart client that uses the Multi-Host feature to populate all instances in the cluster.
- Use VIPs bound in front of Haproxy (Layer 2 or 4)
- Use external load balancers to guarantee
- Use DNS polling to resolve to multiple Haproxy, clients will re-execute DNS resolution and retry after a disconnect.
Patroni’s behavior in case of failure
| 场景 |
位置 |
Patroni的动作 |
| PG Down |
replica |
尝试重新拉起PG |
| Patroni Down |
replica |
PG随之关闭(维护模式下不变) |
| Patroni Crash |
replica |
PG不会随Patroni一并关闭 |
| DCS Network Partition |
replica |
无事 |
| Promote |
replica |
将PG降为从库并重新挂至主库。 |
| PG Down |
primary |
尝试重启PG
超过master_start_timeout后执行Failover |
| Patroni Down |
primary |
关闭PG并触发Failover |
| Patroni Crash |
primary |
触发Failover,可能触发脑裂。
可通过watchdog fencing避免。 |
| DCS Network Partition |
primary |
主库降级为从库,触发Failover |
| DCS Down |
DCS |
主库降级为从库,集群中没有主库,不可写入。 |
| 同步模式下无可用备选 |
|
临时切换为异步复制。
恢复为同步复制前不会Failover |
The proper configuration of Patroni can handle most failures. However, a scenario like DCS Down (Consul/Etcd down or network unreachable) will render all production database clusters unwritable and requires special attention. **Must ensure that DCS availability is higher than database availability. **
Known Issue
Please try to ensure that the server’s time synchronization service starts before Patroni.
4.4 - File Structure
Introduction to pigsty file structure hierarchy
The following parameters are related to the Pigsty directory structure
- pg_dbsu_home: home directory of the default user of Postgres, default is
/var/lib/pgsql
- pg_bin_dir: Postgres binary directory, defaults to
/usr/pgsql/bin/
- pg_data: Postgres database directory, defaults to
/pg/data
- pg_fs_main: Postgres main data disk mount point, default is
/export
- pg_fs_bkup: Postgres backup disk mount point, default is
/var/backups (optional, you can also choose to backup to the main data disk)
Overview
#------------------------------------------------------------------------------
# Create Directory
#------------------------------------------------------------------------------
# this assumes that
#   /pg is shortcut for postgres home
#   {{ pg_fs_main }} contains the main data             (MUST ALREADY MOUNTED)
#   {{ pg_fs_bkup }} contains archive and backup data   (MUST ALREADY MOUNTED)
#   cluster-version is the default parent folder for pgdata (e.g pg-test-12)
#------------------------------------------------------------------------------
# default variable:
#     pg_fs_main = /export           fast ssd
#     pg_fs_bkup = /var/backups      cheap hdd
#
#     /pg      -> /export/postgres/pg-test-12
#     /pg/data -> /export/postgres/pg-test-12/data
#------------------------------------------------------------------------------
- name: Create postgresql directories
  tags: pg_dir
  become: yes
  block:
    - name: Make sure main and backup dir exists
      file: path={{ item }} state=directory owner=root mode=0777
      with_items:
        - "{{ pg_fs_main }}"
        - "{{ pg_fs_bkup }}"

    # pg_cluster_dir:    "{{ pg_fs_main }}/postgres/{{ pg_cluster }}-{{ pg_version }}"
    - name: Create postgres directory structure
      file: path={{ item }} state=directory owner={{ pg_dbsu }} group=postgres mode=0700
      with_items:
        - "{{ pg_fs_main }}/postgres"
        - "{{ pg_cluster_dir }}"
        - "{{ pg_cluster_dir }}/bin"
        - "{{ pg_cluster_dir }}/log"
        - "{{ pg_cluster_dir }}/tmp"
        - "{{ pg_cluster_dir }}/conf"
        - "{{ pg_cluster_dir }}/data"
        - "{{ pg_cluster_dir }}/meta"
        - "{{ pg_cluster_dir }}/stat"
        - "{{ pg_cluster_dir }}/change"
        - "{{ pg_backup_dir }}/postgres"
        - "{{ pg_backup_dir }}/arcwal"
        - "{{ pg_backup_dir }}/backup"
        - "{{ pg_backup_dir }}/remote"
PG二进制目录结构
在RedHat/CentOS上,默认的Postgres发行版安装位置为
/usr/pgsql-${pg_version}/
安装剧本会自动创建指向当前安装版本的软连接,例如,如果安装了13版本的Postgres,则有:
/usr/pgsql -> /usr/pgsql-13
因此,默认的pg_bin_dir为/usr/pgsql/bin/,该路径会在/etc/profile.d/pgsql.sh中添加至所有用户的PATH环境变量中。
PG数据目录结构
Pigsty假设用于部署数据库实例的单个节点上至少有一块主数据盘(pg_fs_main),以及一块可选的备份数据盘(pg_fs_bkup)。通常主数据盘是高性能SSD,而备份盘是大容量廉价HDD。
#------------------------------------------------------------------------------
# Create Directory
#------------------------------------------------------------------------------
# this assumes that
#   /pg is shortcut for postgres home
#   {{ pg_fs_main }} contains the main data             (MUST ALREADY MOUNTED)
#   {{ pg_fs_bkup }} contains archive and backup data   (MAYBE ALREADY MOUNTED)
#   {{ pg_cluster }}-{{ pg_version }} is the default parent folder
#    for pgdata (e.g pg-test-12)
#------------------------------------------------------------------------------
# default variable:
#     pg_fs_main = /export           fast ssd
#     pg_fs_bkup = /var/backups      cheap hdd
#
#     /pg      -> /export/postgres/pg-test-12
#     /pg/data -> /export/postgres/pg-test-12/data
PG数据库集簇目录结构
# basic
{{ pg_fs_main }}     /export                      # contains all business data (pg,consul,etc..)
{{ pg_dir_main }}    /export/postgres             # contains postgres main data
{{ pg_cluster_dir }} /export/postgres/pg-test-13  # contains cluster `pg-test` data (of version 13)
                     /export/postgres/pg-test-13/bin            # binary scripts
                     /export/postgres/pg-test-13/log            # misc logs
                     /export/postgres/pg-test-13/tmp            # tmp, sql files, records
                     /export/postgres/pg-test-13/conf           # configurations
                     /export/postgres/pg-test-13/data           # main data directory
                     /export/postgres/pg-test-13/meta           # identity information
                     /export/postgres/pg-test-13/stat           # stats information
                     /export/postgres/pg-test-13/change         # changing records

{{ pg_fs_bkup }}     /var/backups                      # contains all backup data (pg,consul,etc..)
{{ pg_dir_bkup }}    /var/backups/postgres             # contains postgres backup data
{{ pg_backup_dir }}  /var/backups/postgres/pg-test-13  # contains cluster `pg-test` backup (of version 13)
                     /var/backups/postgres/pg-test-13/backup   # base backup
                     /var/backups/postgres/pg-test-13/arcwal   # WAL archive
                     /var/backups/postgres/pg-test-13/remote   # mount NFS/S3 remote resources here

# links
/pg             -> /export/postgres/pg-test-12               # pg root link
/pg/data        -> /export/postgres/pg-test-12/data          # real data dir
/pg/backup      -> /var/backups/postgres/pg-test-13/backup   # base backup
/pg/arcwal      -> /var/backups/postgres/pg-test-13/arcwal   # WAL archive
/pg/remote      -> /var/backups/postgres/pg-test-13/remote   # mount NFS/S3 remote resources here
Pgbouncer配置文件结构
Pgbouncer使用Postgres用户运行,配置文件位于/etc/pgbouncer。配置文件包括:
pgbouncer.ini,主配置文件userlist.txt:列出连接池中的用户pgb_hba.conf:列出连接池用户的访问权限database.txt:列出连接池中的数据库
4.5 - Access Control
Introduction to Pigsty ACL models
PostgreSQL提供了两类访问控制机制:认证(Authentication) 与 权限(Privileges)
Pigsty带有基本的访问控制模型,足以覆盖绝大多数应用场景。
用户体系
Pigsty的默认权限系统包含四个默认用户与四类默认角色 。
用户可以通过修改 pg_default_roles 来修改默认用户的名字,但默认角色的名字不建议新用户自行修改。
默认角色
Pigsty带有四个默认角色:
- 只读角色(
dbrole_readonly):只读
- 读写角色(
dbrole_readwrite):读写,继承dbrole_readonly
- 管理角色(
dbrole_admin):�执行DDL变更,继承dbrole_readwrite
- 离线角色(
dbrole_offline):只读,用于执行慢查询/ETL/交互查询,仅允许在特定实例上访问。
默认用户
Pigsty带有四个默认用户:
- 超级用户(
postgres),数据库的拥有者与创建者,与操作系统用户一致
- 复制用户(
replicator),用于主从复制的用户。
- 监控用户(
dbuser_monitor),用于监控数据库指标的用户。
- 管理员(
dbuser_admin),执行日常管理操作与数据库变更。(通常供DBA使用)
| name |
attr |
roles |
desc |
| dbrole_readonly |
Cannot login |
|
role for global readonly access |
| dbrole_readwrite |
Cannot login |
dbrole_readonly |
role for global read-write access |
| dbrole_offline |
Cannot login |
|
role for restricted read-only access (offline instance) |
| dbrole_admin |
Cannot login
Bypass RLS |
pg_monitor
pg_signal_backend
dbrole_readwrite |
role for object creation |
| postgres |
Superuser
Create role
Create DB
Replication
Bypass RLS |
|
system superuser |
| replicator |
Replication
Bypass RLS |
pg_monitor
dbrole_readonly |
system replicator |
| dbuser_monitor |
16 connections |
pg_monitor
dbrole_readonly |
system monitor user |
| dbuser_admin |
Bypass RLS
Superuser |
dbrole_admin |
system admin user |
相关配置
以下是8个默认用户/角色的相关变量
默认用户有专用的用户名与密码配置选项,会覆盖 pg_default_roles中的选项。因此无需在其中为默认用户配置密码。
出于安全考虑,不建议为DBSU配置密码,故pg_dbsu没有专门的密码配置项。如有需要,用户可以在pg_default_roles中为超级用户指定密码。
# - system roles - #
pg_replication_username: replicator           # system replication user
pg_replication_password: DBUser.Replicator    # system replication password
pg_monitor_username: dbuser_monitor           # system monitor user
pg_monitor_password: DBUser.Monitor           # system monitor password
pg_admin_username: dbuser_admin               # system admin user
pg_admin_password: DBUser.Admin               # system admin password

# - default roles - #
# chekc http://pigsty.cc/zh/docs/concepts/provision/acl/ for more detail
pg_default_roles:

  # common production readonly user
  - name: dbrole_readonly                 # production read-only roles
    login: false
    comment: role for global readonly access

  # common production read-write user
  - name: dbrole_readwrite                # production read-write roles
    login: false
    roles: [dbrole_readonly]             # read-write includes read-only access
    comment: role for global read-write access

  # offline have same privileges as readonly, but with limited hba access on offline instance only
  # for the purpose of running slow queries, interactive queries and perform ETL tasks
  - name: dbrole_offline
    login: false
    comment: role for restricted read-only access (offline instance)

  # admin have the privileges to issue DDL changes
  - name: dbrole_admin
    login: false
    bypassrls: true
    comment: role for object creation
    roles: [dbrole_readwrite,pg_monitor,pg_signal_backend]

  # dbsu, name is designated by `pg_dbsu`. It's not recommend to set password for dbsu
  - name: postgres
    superuser: true
    comment: system superuser

  # default replication user, name is designated by `pg_replication_username`, and password is set by `pg_replication_password`
  - name: replicator
    replication: true
    roles: [pg_monitor, dbrole_readonly]
    comment: system replicator

  # default replication user, name is designated by `pg_monitor_username`, and password is set by `pg_monitor_password`
  - name: dbuser_monitor
    connlimit: 16
    comment: system monitor user
    roles: [pg_monitor, dbrole_readonly]

  # default admin user, name is designated by `pg_admin_username`, and password is set by `pg_admin_password`
  - name: dbuser_admin
    bypassrls: true
    comment: system admin user
    roles: [dbrole_admin]

  # default stats user, for ETL and slow queries
  - name: dbuser_stats
    password: DBUser.Stats
    comment: business offline user for offline queries and ETL
    roles: [dbrole_offline]
Pgbouncer用户
Pgbouncer的操作系统用户将与数据库超级用户保持一致,默认都使用postgres。
Pigsty默认会使用Postgres管理用户作为Pgbouncer的管理用户,使用Postgres的监控用户同时作为Pgbouncer的监控用户。
Pgbouncer的用户权限通过/etc/pgbouncer/pgb_hba.conf进行控制。
Pgbounce的用户列表通过/etc/pgbouncer/userlist.txt文件进行控制。
定义用户时,只有显式添加pgbouncer: true 的用户,才会被加入到Pgbouncer的用户列表中。
用户的定义
Pigsty中的用户可以通过以下两个参数进行声明,两者使用同样的形式:
用户的创建
Pigsty的用户可以通过 pgsql-createuser.yml 剧本完成创建
权限模型
默认情况下,角色拥有的权限如下所示:
GRANT USAGE                         ON SCHEMAS   TO dbrole_readonly
GRANT SELECT                        ON TABLES    TO dbrole_readonly
GRANT SELECT                        ON SEQUENCES TO dbrole_readonly
GRANT EXECUTE                       ON FUNCTIONS TO dbrole_readonly
GRANT USAGE                         ON SCHEMAS   TO dbrole_offline
GRANT SELECT                        ON TABLES    TO dbrole_offline
GRANT SELECT                        ON SEQUENCES TO dbrole_offline
GRANT EXECUTE                       ON FUNCTIONS TO dbrole_readonly
GRANT INSERT, UPDATE, DELETE        ON TABLES    TO dbrole_readwrite
GRANT USAGE,  UPDATE                ON SEQUENCES TO dbrole_readwrite
GRANT TRUNCATE, REFERENCES, TRIGGER ON TABLES    TO dbrole_admin
GRANT CREATE                        ON SCHEMAS   TO dbrole_admin
GRANT USAGE                         ON TYPES     TO dbrole_admin
其他业务用户默认都应当属于四种默认角色之一:只读,读写,管理员,离线访问。
| Owner |
Schema |
Type |
Access privileges |
| username |
|
function |
=X/postgres |
|
|
|
postgres=X/postgres |
|
|
|
dbrole_readonly=X/postgres |
|
|
|
dbrole_offline=X/postgres |
| username |
|
schema |
postgres=UC/postgres |
|
|
|
dbrole_readonly=U/postgres |
|
|
|
dbrole_offline=U/postgres |
|
|
|
dbrole_admin=C/postgres |
| username |
|
sequence |
postgres=rwU/postgres |
|
|
|
dbrole_readonly=r/postgres |
|
|
|
dbrole_readwrite=wU/postgres |
|
|
|
dbrole_offline=r/postgres |
| username |
|
table |
postgres=arwdDxt/postgres |
|
|
|
dbrole_readonly=r/postgres |
|
|
|
dbrole_readwrite=awd/postgres |
|
|
|
dbrole_offline=r/postgres |
|
|
|
dbrole_admin=Dxt/postgres |
所有用户都可以访问所有模式,只读用户可以读取所有表,读写用户可以对所有表进行DML操作,管理员可以执行DDL变更操作。离线用户与只读用户类似,但只允许访问pg_role == 'offline' 或带有 pg_offline_query = true 的实例。
数据库权限
数据库有三种权限:CONNECT, CREATE, TEMP,以及特殊的属主OWNERSHIP。数据库的定义由参数 pg_database 控制。一个完整的数据库定义如下所示:
pg_databases:
  - name: meta                      # name is the only required field for a database
    owner: postgres                 # optional, database owner
    template: template1             # optional, template1 by default
    encoding: UTF8                  # optional, UTF8 by default
    locale: C                       # optional, C by default
    allowconn: true                 # optional, true by default, false disable connect at all
    revokeconn: false               # optional, false by default, true revoke connect from public # (only default user and owner have connect privilege on database)
    tablespace: pg_default          # optional, 'pg_default' is the default tablespace
    connlimit: -1                   # optional, connection limit, -1 or none disable limit (default)
    extensions:                     # optional, extension name and where to create
      - {name: postgis, schema: public}
    parameters:                     # optional, extra parameters with ALTER DATABASE
      enable_partitionwise_join: true
    pgbouncer: true                 # optional, add this database to pgbouncer list? true by default
    comment: pigsty meta database   # optional, comment string for database
默认情况下,如果数据库没有配置属主,那么数据库超级用户dbsu将会作为数据库的默认OWNER,否则将为指定用户。
默认情况下,所有用户都具有对新创建数据库的CONNECT 权限,如果希望回收该权限,设置 revokeconn == true,则该权限会被回收。只有默认用户(dbsu|admin|monitor|replicator)与数据库的属主才会被显式赋予CONNECT权限。同时,admin|owner将会具有CONNECT权限的GRANT OPTION,可以将CONNECT权限转授他人。
如果希望实现不同数据库之间的访问隔离,可以为每一个数据库创建一个相应的业务用户作为owner,并全部设置revokeconn选项。这种配置对于多租户实例尤为实用。
创建新对象
默认情况下,出于安全考虑,Pigsty会撤销PUBLIC用户在数据库下CREATE新模式的权限,同时也会撤销PUBLIC用户在public模式下创建新关系的权限。数据库超级用户与管理员不受此限制,他们总是可以在任何地方执行DDL变更。
Pigsty非常不建议使用业务用户执行DDL变更,因为PostgreSQL的ALTER DEFAULT PRIVILEGE仅针对“由特定用户创建的对象”生效,默认情况下超级用户postgres和dbuser_admin创建的对象拥有默认的权限配置,如果用户希望授予业务用户dbrole_admin,请在使用该业务管理员执行DDL变更时首先执行:
SET ROLE dbrole_admin; -- dbrole_admin 创建的对象具有正确的默认权限
在数据库中创建对象的权限与用户是否为数据库属主无关,这只取决于创建该用户时是否为该用户赋予管理员权限。
pg_users:
  - {name: test1, password: xxx , groups: [dbrole_readwrite]}  # 不能创建Schema与对象
  - {name: test2, password: xxx , groups: [dbrole_admin]}      # 可以创建Schema与对象
认证模型
HBA是Host Based Authentication的缩写,可以将其视作IP黑白名单。
HBA配置方式
在Pigsty中,所有实例的HBA都由配置文件生成而来,最终生成的HBA规则取决于实例的角色(pg_role)
Pigsty的HBA由下列变量控制:
pg_hba_rules: 环境统一的HBA规则pg_hba_rules_extra: 特定于实例或集群的HBA规则pgbouncer_hba_rules: 链接池使用的HBA规则pgbouncer_hba_rules_extra: 特定于实例或集群的链接池HBA规则
每个变量都是由下列样式的规则组成的数组:
- title: allow intranet admin password access
  role: common
  rules:
    - host    all     +dbrole_admin               10.0.0.0/8          md5
    - host    all     +dbrole_admin               172.16.0.0/12       md5
    - host    all     +dbrole_admin               192.168.0.0/16      md5
基于角色的HBA
role = common的HBA规则组会安装到所有的实例上,而其他的取值,例如(role : primary)则只会安装至pg_role = primary的实例上。因此用户可以通过角色体系定义灵活的HBA规则。
作为一个特例,role: offline 的HBA规则,除了会安装至pg_role == 'offline'的实例,也会安装至pg_offline_query == true的实例上。
默认配置
在默认配置下,主库与从库会使用以下的HBA规则:
- 超级用户通过本地操作系统认证访问
- 其他用户可以从本地用密码访问
- 复制用户可以从局域网段通过密码访问
- 监控用户可以通过本地访问
- 所有人都可以在元节点上使用密码访问
- 管理员可以从局域网通过密码访问
- 所有人都可以从内网通过密码访问
- 读写用户(生产业务账号)可以通过本地(链接池)访问
(部分访问控制转交链接池处理)
- 在从库上:只读用户(个人)可以从本地(链接池)访问。
(意味主库上拒绝只读用户连接)
pg_role == 'offline' 或带有pg_offline_query == true的实例上,会添加允许dbrole_offline分组用户访问的HBA规则。
#==============================================================#
# Default HBA
#==============================================================#
# allow local su with ident"
local   all             postgres                               ident
local   replication     postgres                               ident

# allow local user password access
local   all             all                                    md5

# allow local/intranet replication with password
local   replication     replicator                              md5
host    replication     replicator         127.0.0.1/32         md5
host    all             replicator         10.0.0.0/8           md5
host    all             replicator         172.16.0.0/12        md5
host    all             replicator         192.168.0.0/16       md5
host    replication     replicator         10.0.0.0/8           md5
host    replication     replicator         172.16.0.0/12        md5
host    replication     replicator         192.168.0.0/16       md5

# allow local role monitor with password
local   all             dbuser_monitor                          md5
host    all             dbuser_monitor      127.0.0.1/32        md5

#==============================================================#
# Extra HBA
#==============================================================#
# add extra hba rules here


#==============================================================#
# primary HBA
#==============================================================#


#==============================================================#
# special HBA for instance marked with 'pg_offline_query = true'
#==============================================================#


#==============================================================#
# Common HBA
#==============================================================#
#  allow meta node password access
host    all     all                         10.10.10.10/32      md5

#  allow intranet admin password access
host    all     +dbrole_admin               10.0.0.0/8          md5
host    all     +dbrole_admin               172.16.0.0/12       md5
host    all     +dbrole_admin               192.168.0.0/16      md5

#  allow intranet password access
host    all             all                 10.0.0.0/8          md5
host    all             all                 172.16.0.0/12       md5
host    all             all                 192.168.0.0/16      md5

#  allow local read/write (local production user via pgbouncer)
local   all     +dbrole_readonly                                md5
host    all     +dbrole_readonly           127.0.0.1/32         md5


#==============================================================#
# Ad Hoc HBA
#===========================================================
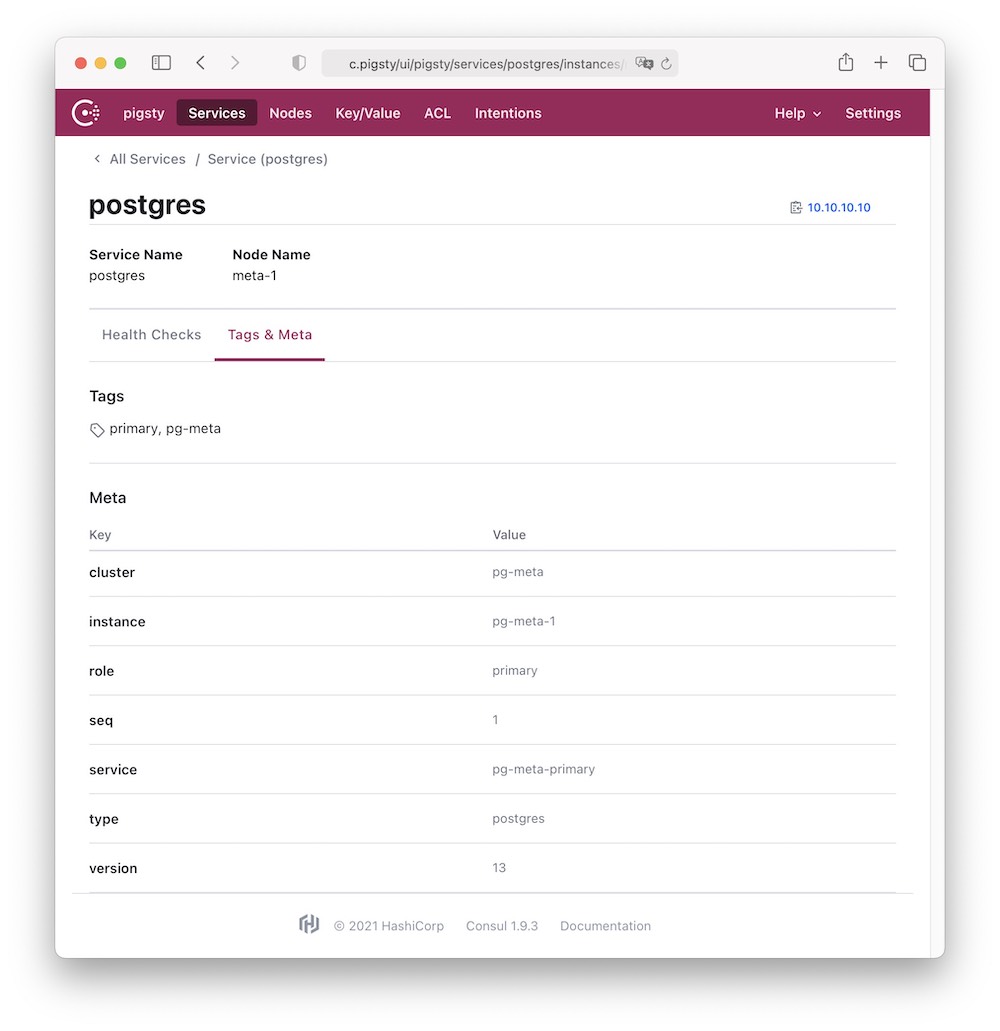
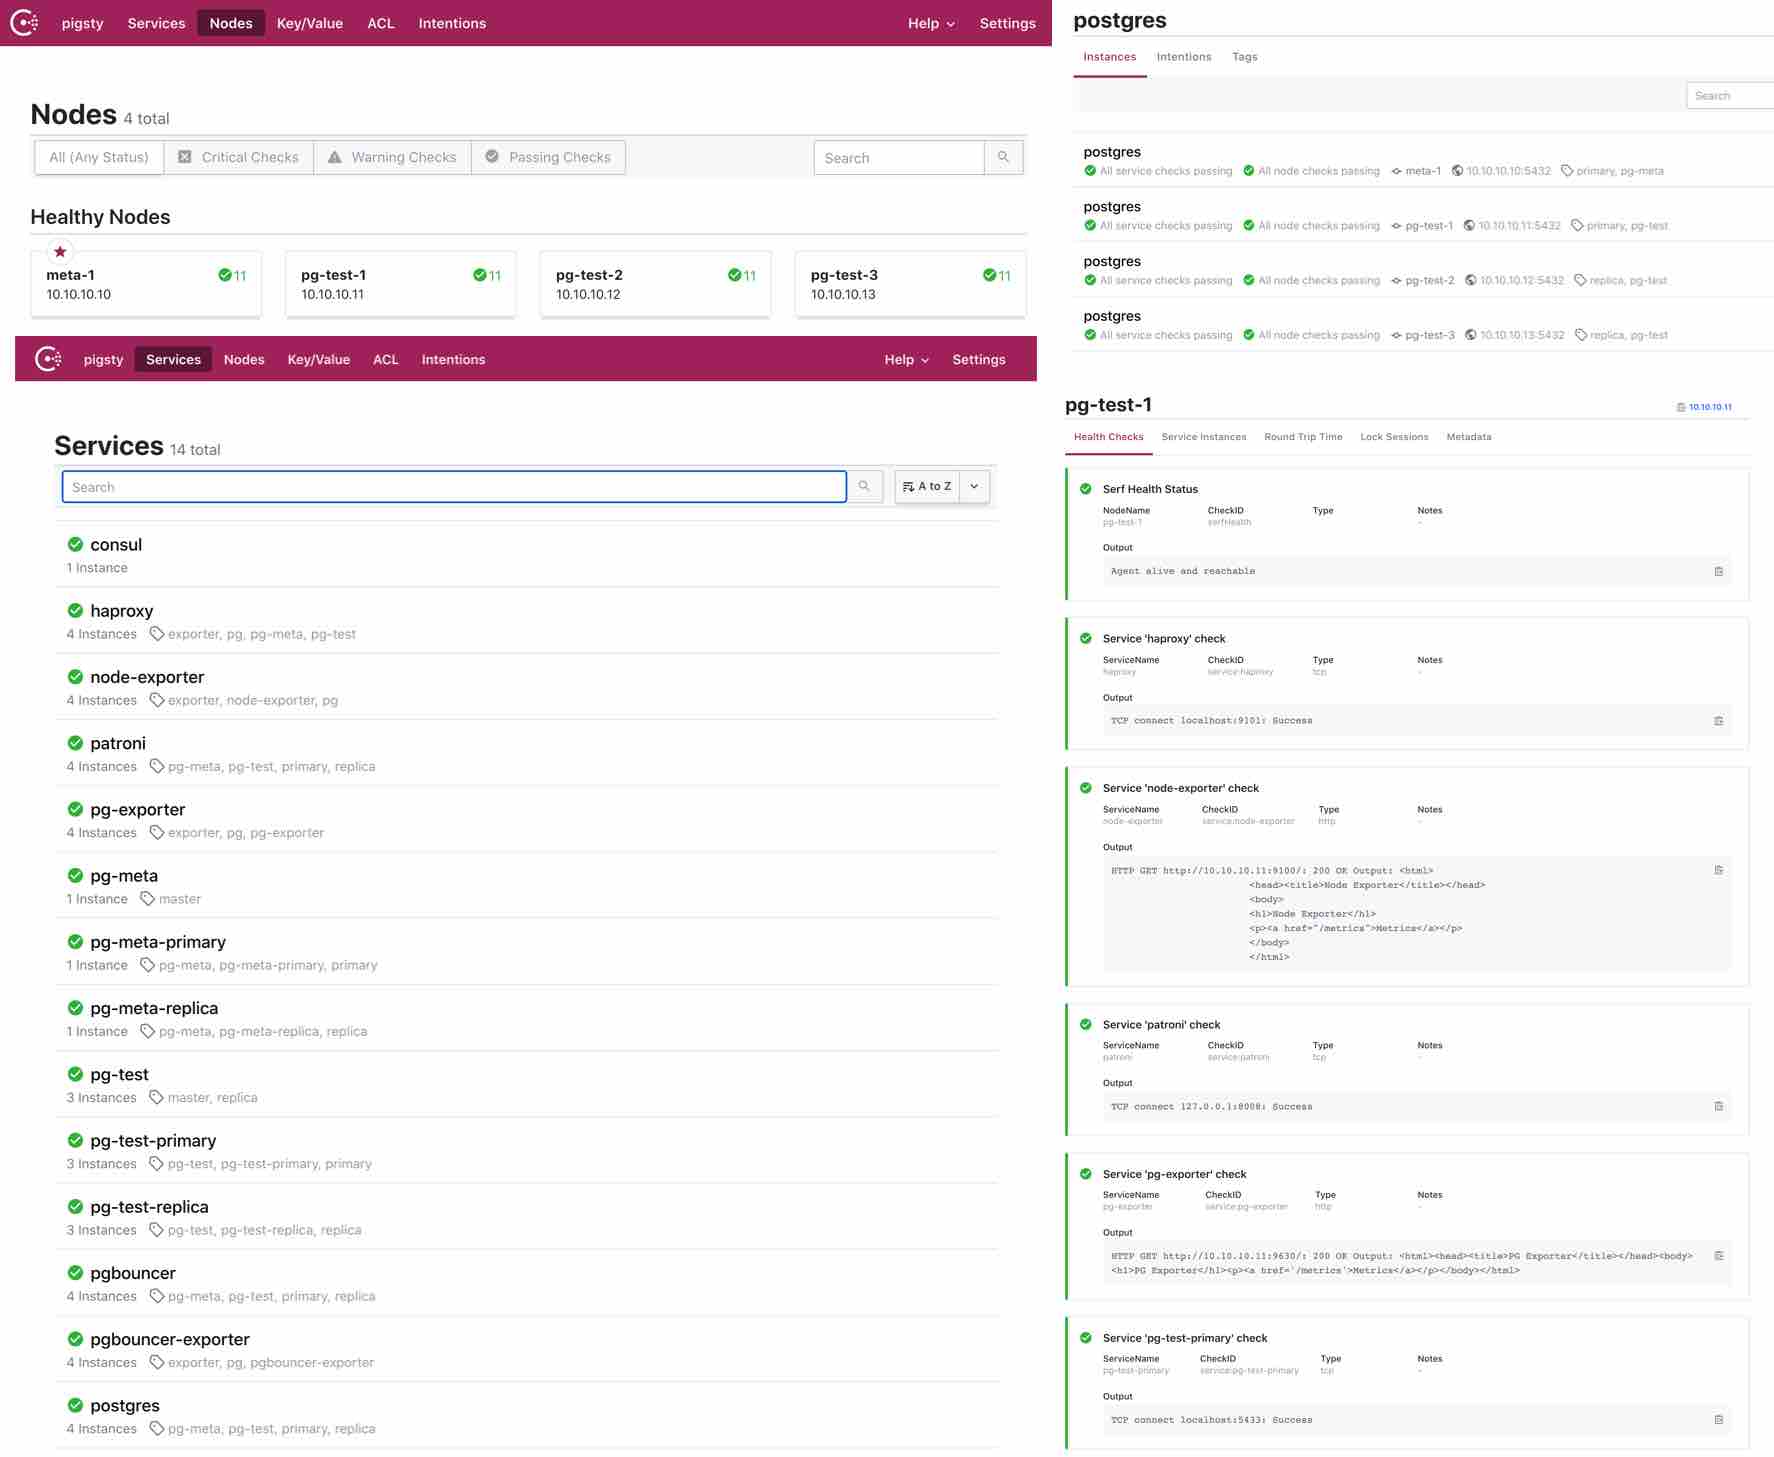