Alerting
Overview
Alarms are critical to daily fault response and to improve system availability.
Missing alarms will lead to reduced availability and False-alert will lead to reduced effectiveness of alarms, so it is necessary to design alarm rules prudently.
- Reasonable definition of alarm levels and the corresponding processing flow
- Reasonable definition of alarm indicators, removal of duplicate alarm items, and replenishment of missing alarm items
- Scientific configuration of alarm thresholds based on historical monitoring data to reduce the false alarm rate.
- Reasonable sparing of special cases of Silence, elimination of maintenance work, false alarms caused by ETL work, and shielding of statistics and offline business alarms.
Taxonomy
By Severity
- P0:FATAL:产生重大场外影响的事故,需要紧急介入处理。例如主库宕机,复制中断。(严重事故)
- P1:ERROR:场外影响轻微,或有冗余处理的事故,需要在分钟级别内进行响应处理。(事故)
- P2:WARNING:即将产生影响,放任可能在小时级别内恶化,需在小时级别进行响应。(关注事件)
- P3:NOTICE:需要关注,不会有即时的影响,但需要在天级别内进行响应。(偏差现象)
By Hierarchy
- 系统级:操作系统,硬件资源的报警。DBA只会特别关注CPU与磁盘报警,其他由运维负责。
- 数据库级:数据库本身的报警,DBA重点关注。由PG,PGB,Exporter本身的监控指标产生。
- 应用级:应用报警由业务方自己负责,但DBA会为QPS,TPS,Rollback,Seasonality等业务指标设置报警
By Metrics Category
- 错误:PG Down, PGB Down, Exporter Down, 流复制中断,单集簇多主
- 流量:QPS,TPS,Rollback,Seasonaility
- 延迟: 平均响应时间,复制延迟
- 饱和度:连接堆积,闲事务数,CPU,磁盘,年龄(事务号),缓冲区
Alerting Visualization
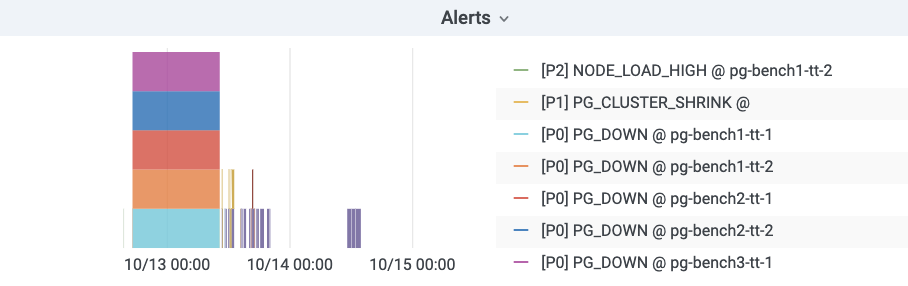
Alert Categories
报警规则按类型可粗略分为四类:错误,延迟,饱和度,流量。其中:
- 错误:主要关注各个组件的存活性(Aliveness),以及网络中断,脑裂等异常情况,级别通常较高(P0|P1)。
- 延迟:主要关注查询响应时间,复制延迟,慢查询,长事务。
- 饱和度:主要关注CPU,磁盘(这两个属于系统监控但对于DB非常重要所以纳入),连接池排队,数据库后端连接数,年龄(本质是可用事物号的饱和度),SSD寿命等。
- 流量:QPS,TPS,Rollback(流量通常与业务指标有关属于业务监控范畴,但因为对于DB很重要所以纳入),QPS的季节性,TPS的突增。
Alter about Errors
Postgres实例宕机区分主从,主库宕机触发P0报警,从库宕机触发P1报警。两者都需要立即介入,但从库通常有多个实例,且可以降级到主库上查询,有着更高的处理余量,所以从库宕机定为P1。
# primary|master instance down for 1m triggers a P0 alert
- alert: PG_PRIMARY_DOWN
  expr: pg_up{instance=~'.*master.*'}
  for: 1m
  labels:
    team: DBA
    urgency: P0
  annotations:
    summary: "P0 Postgres Primary Instance Down: {{$labels.instance}}"
    description: "pg_up = {{ $value }} {{$labels.instance}}"

# standby|slave instance down for 1m triggers a P1 alert
- alert: PG_STANDBY_DOWN
  expr: pg_up{instance!~'.*master.*'}
  for: 1m
  labels:
    team: DBA
    urgency: P1
  annotations:
    summary: "P1 Postgres Standby Instance Down: {{$labels.instance}}"
    description: "pg_up = {{ $value }} {{$labels.instance}}"
Pgbouncer实例因为与Postgres实例一一对应,其存活性报警规则与Postgres统一。
# primary pgbouncer down for 1m triggers a P0 alert
- alert: PGB_PRIMARY_DOWN
  expr: pgbouncer_up{instance=~'.*master.*'}
  for: 1m
  labels:
    team: DBA
    urgency: P0
  annotations:
    summary: "P0 Pgbouncer Primary Instance Down: {{$labels.instance}}"
    description: "pgbouncer_up = {{ $value }} {{$labels.instance}}"

# standby pgbouncer down for 1m triggers a P1 alert
- alert: PGB_STANDBY_DOWN
  expr: pgbouncer_up{instance!~'.*master.*'}
  for: 1m
  labels:
    team: DBA
    urgency: P1
  annotations:
    summary: "P1 Pgbouncer Standby Instance Down: {{$labels.instance}}"
    description: "pgbouncer_up = {{ $value }} {{$labels.instance}}"
Prometheus Exporter的存活性定级为P1,虽然Exporter宕机本身并不影响数据库服务,但这通常预示着一些不好的情况,而且监控数据的缺失也会产生某些相应的报警。Exporter的存活性是通过Prometheus自己的up指标检测的,需要注意某些单实例多DB的特例。
# exporter down for 1m triggers a P1 alert
- alert: PG_EXPORTER_DOWN
  expr: up{port=~"(9185|9127)"} == 0
  for: 1m
  labels:
    team: DBA
    urgency: P1
  annotations:
    summary: "P1 Exporter Down: {{$labels.instance}} {{$labels.port}}"
    description: "port = {{$labels.port}}, {{$labels.instance}}"
所有存活性检测的持续时间阈值设定为1分钟,对15s的默认采集周期而言是四个样本点。常规的重启操作通常不会触发存活性报警。
Alert about Latency
与复制延迟有关的报警有三个:复制中断,复制延迟高,复制延迟异常,分别定级为P1, P2, P3
-
其中复制中断是一种错误,使用指标:
pg_repl_state_count{state="streaming"}进行判断,当前streaming状态的从库如果数量发生负向变动,则触发break报警。walsender会决定复制的状态,从库直接断开会产生此现象,缓冲区出现积压时会从streaming进入catchup状态也会触发此报警。此外,采用-Xs手工制作备份结束时也会产生此报警,此报警会在10分钟后自动Resolve。复制中断会导致客户端读到陈旧的数据,具有一定的场外影响,定级为P1。 -
复制延迟可以使用延迟时间或者延迟字节数判定。以延迟字节数为权威指标。常规状态下,复制延迟时间在百毫秒量级,复制延迟字节在百KB量级均属于正常。目前采用的是5s,15s的时间报警阈值。根据历史经验数据,这里采用了时间8秒与字节32MB的阈值,大致报警频率为每天个位数个。延迟时间更符合直觉,所以采用8s的P2报警,但并不是所有的从库都能有效取到该指标所以使用32MB的字节阈值触发P3报警补漏。
-
特例:
antispam,stats,coredb均经常出现复制延迟。
      # replication break for 1m triggers a P0 alert. auto-resolved after 10 minutes.
      - alert: PG_REPLICATION_BREAK
        expr: pg_repl_state_count{state="streaming"} - (pg_repl_state_count{state="streaming"} OFFSET 10m) < 0
        for: 1m
        labels:
          team: DBA
          urgency: P0
        annotations:
          summary: "P0 Postgres Streaming Replication Break: {{$labels.instance}}"
          description: "delta = {{ $value }} {{$labels.instance}}"

      # replication lag greater than 8 second for 3m triggers a P1 alert
      - alert: PG_REPLICATION_LAG
        expr: pg_repl_replay_lag{application_name="walreceiver"} > 8
        for: 3m
        labels:
          team: DBA
          urgency: P1
        annotations:
          summary: "P1 Postgres Replication Lagged: {{$labels.instance}}"
          description: "lag = {{ $value }} seconds, {{$labels.instance}}"

      # replication diff greater than 32MB for 5m triggers a P3 alert
      - alert: PG_REPLICATOIN_DIFF
        expr: pg_repl_lsn{application_name="walreceiver"} - pg_repl_replay_lsn{application_name="walreceiver"} > 33554432
        for: 5m
        labels:
          team: DBA
          urgency: P3
        annotations:
          summary: "P3 Postgres Replication Diff Deviant: {{$labels.instance}}"
          description: "delta = {{ $value }} {{$labels.instance}}"
Alert about Saturation
饱和度指标主要资源,包含很多系统级监控的指标。主要包括:CPU,磁盘(这两个属于系统监控但对于DB非常重要所以纳入),连接池排队,数据库后端连接数,年龄(本质是可用事物号的饱和度),SSD寿命等。
堆积检测
堆积主要包含两类指标,一方面是PG本身的后端连接数与活跃连接数,另一方面是连接池的排队情况。
PGB排队是决定性的指标,它代表用户端可感知的阻塞已经出现,因此,配置排队超过15持续1分钟触发P0报警。
# more than 8 client waiting in queue for 1 min triggers a P0 alert
- alert: PGB_QUEUING
  expr: sum(pgbouncer_pool_waiting_clients{datname!="pgbouncer"}) by (instance,datname) > 8
  for: 1m
  labels:
    team: DBA
    urgency: P0
  annotations:
    summary: "P0 Pgbouncer {{ $value }} Clients Wait in Queue: {{$labels.instance}}"
    description: "waiting clients = {{ $value }} {{$labels.instance}}"
后端连接数是一个重要的报警指标,如果后端连接持续达到最大连接数,往往也意味着雪崩。连接池的排队连接数也能反映这种情况,但不能覆盖应用直连数据库的情况。后端连接数的主要问题是它与连接池关系密切,连接池在短暂堵塞后会迅速打满后端连接,但堵塞恢复后这些连接必须在默认约10min的Timeout后才被释放。因此收到短暂堆积的影响较大。同时外晚上1点备份时也会出现这种情况,容易产生误报。
注意后端连接数与后端活跃连接数不同,目前报警使用的是活跃连接数。后端活跃连接数通常在0~1,一些慢库在十几左右,离线库可能会达到20~30。但后端连接/进程数(不管活跃不活跃),通常均值可达50。后端连接数更为直观准确。
对于后端连接数,这里使用两个等级的报警:超过90持续3分钟P1,以及超过80持续10分钟P2,考虑到通常数据库最大连接数为100。这样做可以以尽可能低的误报率检测到雪崩堆积。
# num of backend exceed 90 for 3m
- alert: PG_BACKEND_HIGH
  expr: sum(pg_db_numbackends) by (node) > 90
  for: 3m
  labels:
    team: DBA
    urgency: P1
  annotations:
    summary: "P1 Postgres Backend Number High: {{$labels.instance}}"
    description: "numbackend = {{ $value }} {{$labels.instance}}"

# num of backend exceed 80 for 10m (avoid pgbouncer jam false alert)
- alert: PG_BACKEND_WARN
  expr: sum(pg_db_numbackends) by (node) > 80
  for: 10m
  labels:
    team: DBA
    urgency: P2
  annotations:
    summary: "P2 Postgres Backend Number Warn: {{$labels.instance}}"
    description: "numbackend = {{ $value }} {{$labels.instance}}"
空闲事务
目前监控使用IDEL In Xact的绝对数量作为报警条件,其实 Idle In Xact的最长持续时间可能会更有意义。因为这种现象其实已经被后端连接数覆盖了。长时间的空闲是我们真正关注的,因此这里使用所有空闲事务中最高的闲置时长作为报警指标。设置3分钟为P2报警阈值。经常出现IDLE的非Offline库有:moderation, location, stats,sms, device, moderationdevice
# max idle xact duration exceed 3m
- alert: PG_IDLE_XACT
  expr: pg_activity_max_duration{instance!~".*offline.*", state=~"^idle in transaction.*"} > 180
  for: 3m
  labels:
    team: DBA
    urgency: P2
  annotations:
    summary: "P2 Postgres Long Idle Transaction: {{$labels.instance}}"
    description: "duration = {{ $value }} {{$labels.instance}}"
资源报警
CPU, 磁盘,AGE
默认清理年龄为2亿,超过10Y报P1,既留下了充分的余量,又不至于让人忽视。
# age wrap around (progress in half 10Y) triggers a P1 alert
- alert: PG_XID_WRAP
  expr: pg_database_age{} > 1000000000
  for: 3m
  labels:
    team: DBA
    urgency: P1
  annotations:
    summary: "P1 Postgres XID Wrap Around: {{$labels.instance}}"
    description: "age = {{ $value }} {{$labels.instance}}"
磁盘和CPU由运维配置,不变
Alert about Traffic
因为各个业务的负载情况不一,为流量指标设置绝对值是相对困难的。这里只对TPS和Rollback设置绝对值指标。而且较为宽松。
Rollback OPS超过4则发出P3警告,TPS超过24000发P2,超过30000发P1
# more than 30k TPS lasts for 1m triggers a P1 (pgbouncer bottleneck)
- alert: PG_TPS_HIGH
  expr: rate(pg_db_xact_total{}[1m]) > 30000
  for: 1m
  labels:
    team: DBA
    urgency: P1
  annotations:
    summary: "P1 Postgres TPS High: {{$labels.instance}} {{$labels.datname}}"
    description: "TPS = {{ $value }} {{$labels.instance}}"

# more than 24k TPS lasts for 3m triggers a P2
- alert: PG_TPS_WARN
  expr: rate(pg_db_xact_total{}[1m]) > 24000
  for: 3m
  labels:
    team: DBA
    urgency: P2
  annotations:
    summary: "P2 Postgres TPS Warning: {{$labels.instance}} {{$labels.datname}}"
    description: "TPS = {{ $value }} {{$labels.instance}}"

# more than 4 rollback per seconds lasts for 5m
- alert: PG_ROLLBACK_WARN
  expr: rate(pg_db_xact_rollback{}[1m]) > 4
  for: 5m
  labels:
    team: DBA
    urgency: P2
  annotations:
    summary: "P2 Postgres Rollback Warning: {{$labels.instance}}"
    description: "rollback per sec = {{ $value }} {{$labels.instance}}"
QPS的指标与业务高度相关,因此不适合配置绝对值,可以为QPS突增配置一个报警项
短时间(和10分钟)前比突增30%会触发一个P2警报,同时避免小QPS下的突发流量,设置一个绝对阈值10k
# QPS > 10000 and have a 30% inc for 3m triggers P2 alert
- alert: PG_QPS_BURST
  expr: sum by(datname,instance)(rate(pgbouncer_stat_total_query_count{datname!="pgbouncer"}[1m]))/sum by(datname,instance) (rate(pgbouncer_stat_total_query_count{datname!="pgbouncer"}[1m] offset 10m)) > 1.3 and sum by(datname,instance) (rate(pgbouncer_stat_total_query_count{datname!="pgbouncer"}[1m])) > 10000
  for: 3m
  labels:
    team: DBA
    urgency: P1
  annotations:
    summary: "P2 Pgbouncer QPS Burst 30% and exceed 10000: {{$labels.instance}}"
    description: "qps = {{ $value }} {{$labels.instance}}"
Prometheus Alerting Rules
The complete alarm rules are detailed in:Reference - Alerting Rules