Architecture
Introduction to Pigsty Architecture
Pigsty’s monitoring system is built in part entirely on open source components, with core components including
-
Grafana for presenting the monitoring interface
-
Prometheus for collecting and storing query time series metrics
-
Node Exporter for exposing machine metrics
-
Self-developed PG Exporter for exposing database and connection pools
-
Consul for service discovery
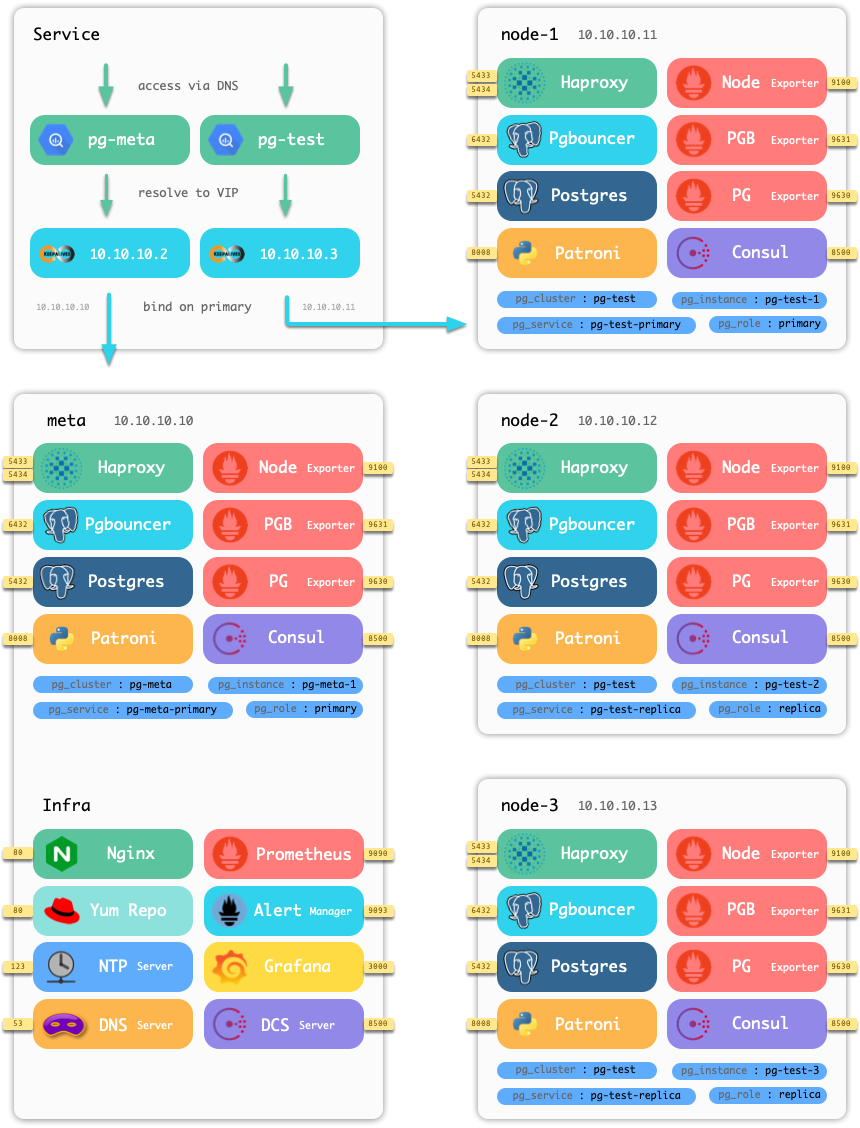
Example
Taking the four-node sandbox environment that comes with Pigsty as an example, the main components involved in Pigsty are shown below.
Last modified 2021-01-10: update en docs (9c05029)