Compare
Overview
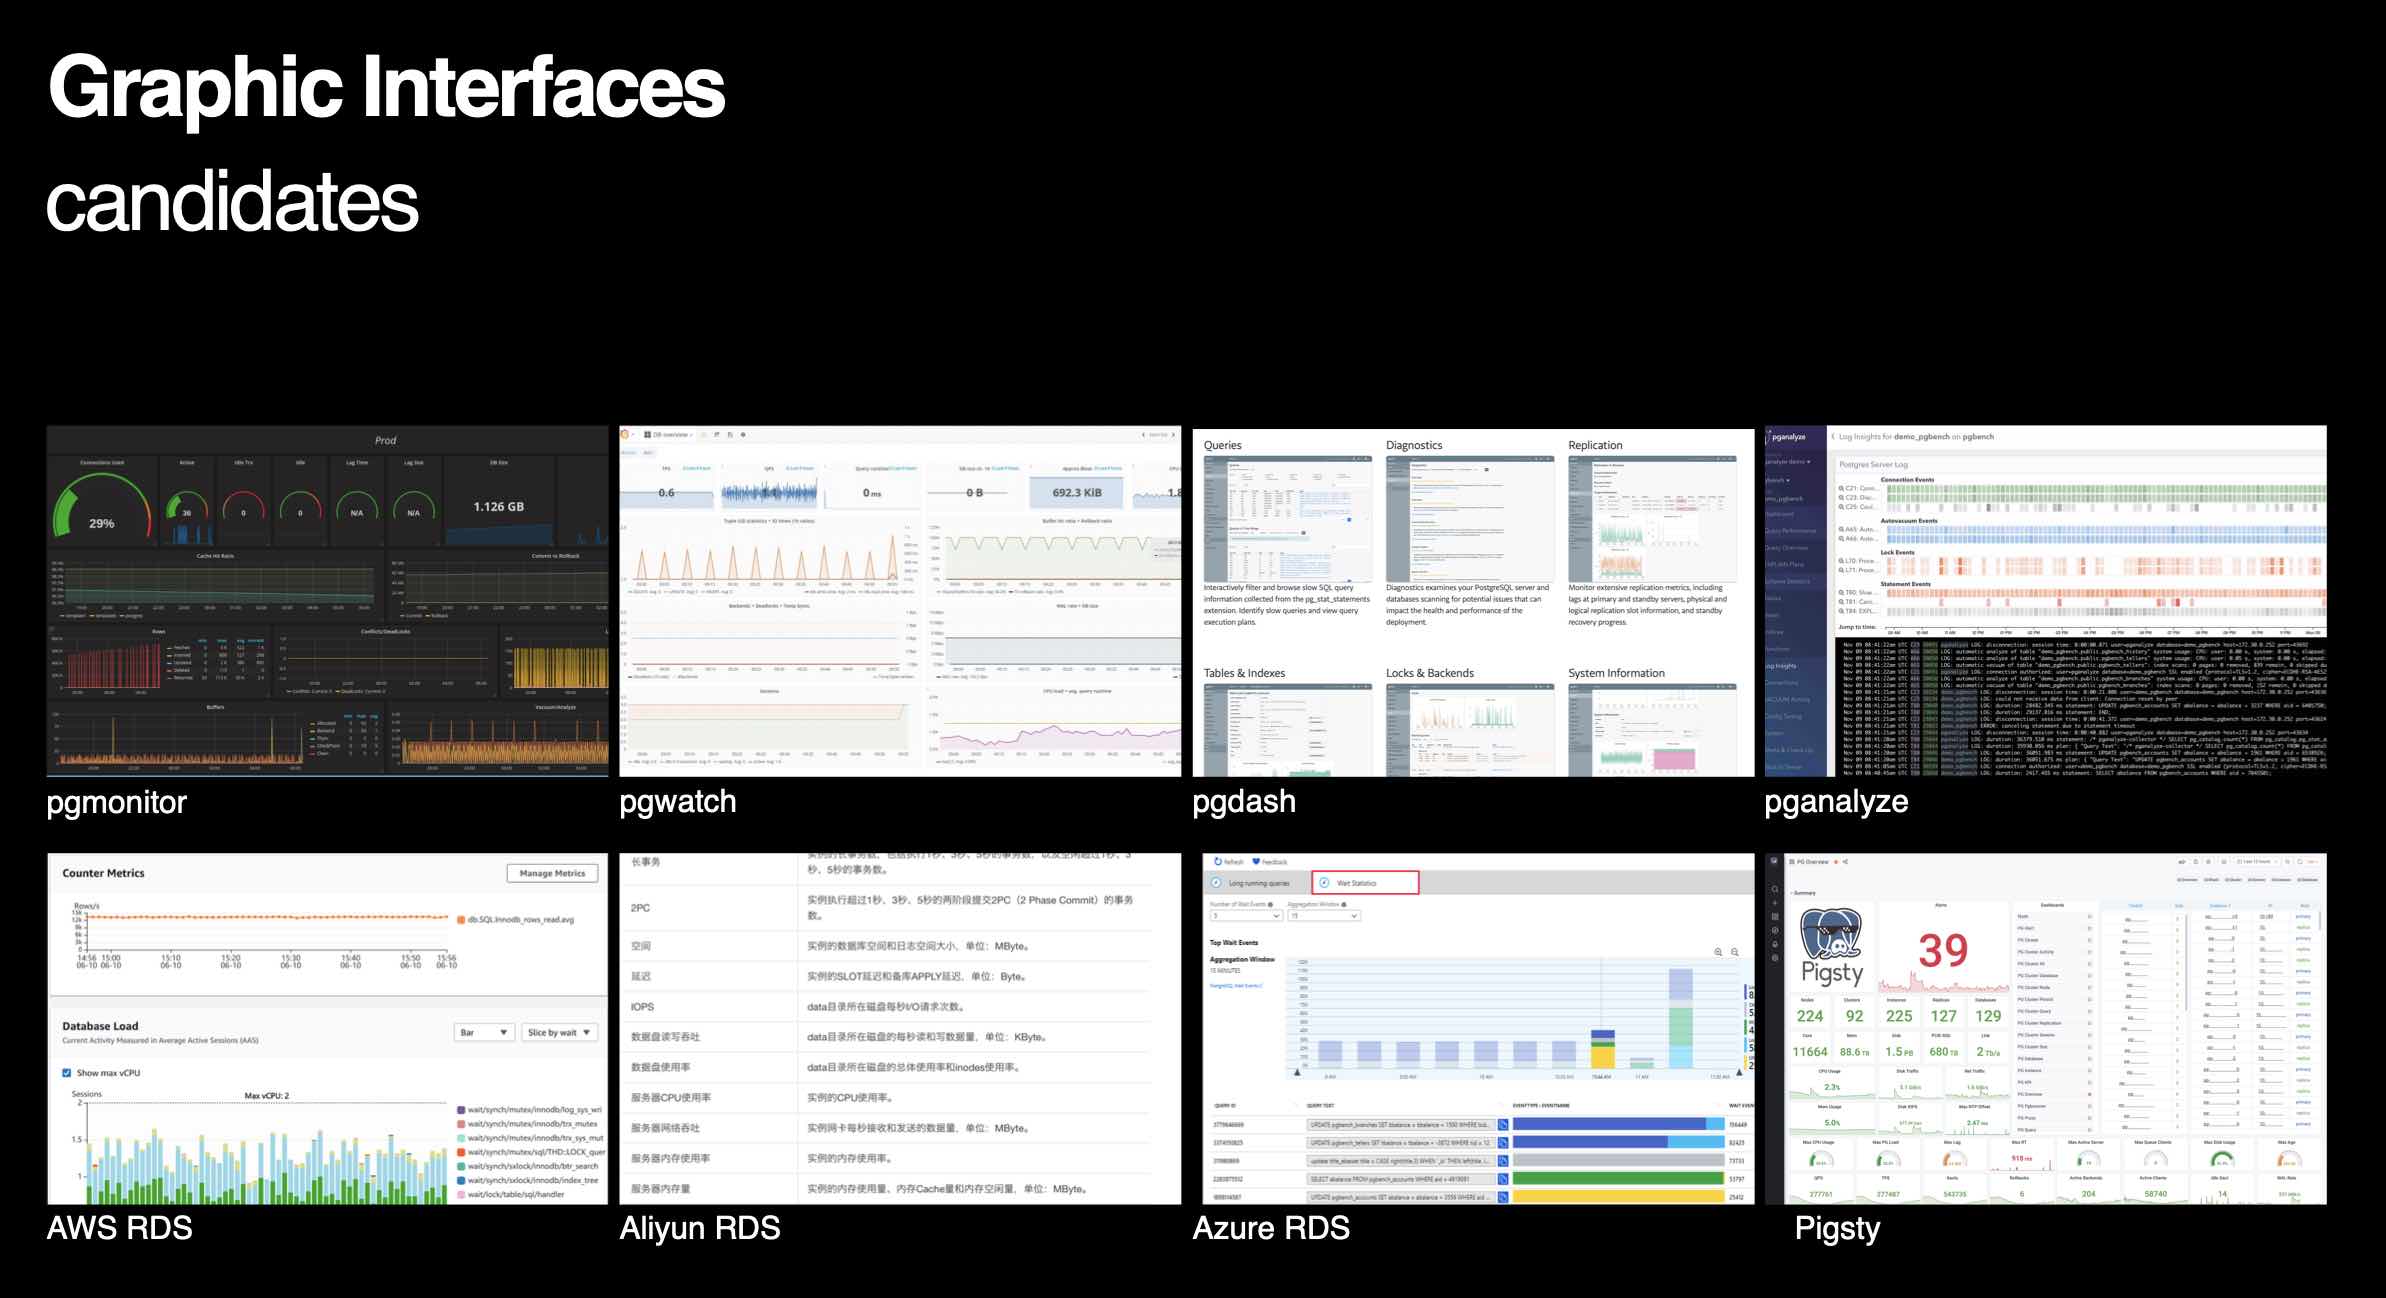
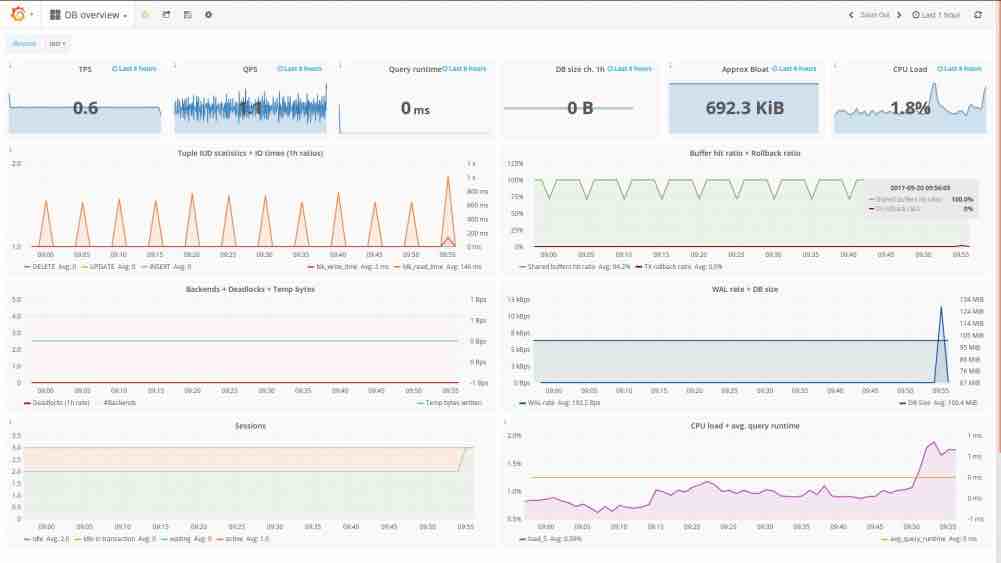
some candidates:
Comparsion
Here is a cross-sectional comparison of the number of metrics. Only database-related metrics are taken here, meaning that the machine CPU disk metrics are left aside.
There are some open source, or commercial, or cloud vendor’s PG monitoring system, here according to their publicly available code or documentation for statistics. A family of words is suspected of selling the melon and boasting, welcome your correction. At least on the order of magnitude, this chart is still not too much of a problem, refer to the link at the end of the article for details.
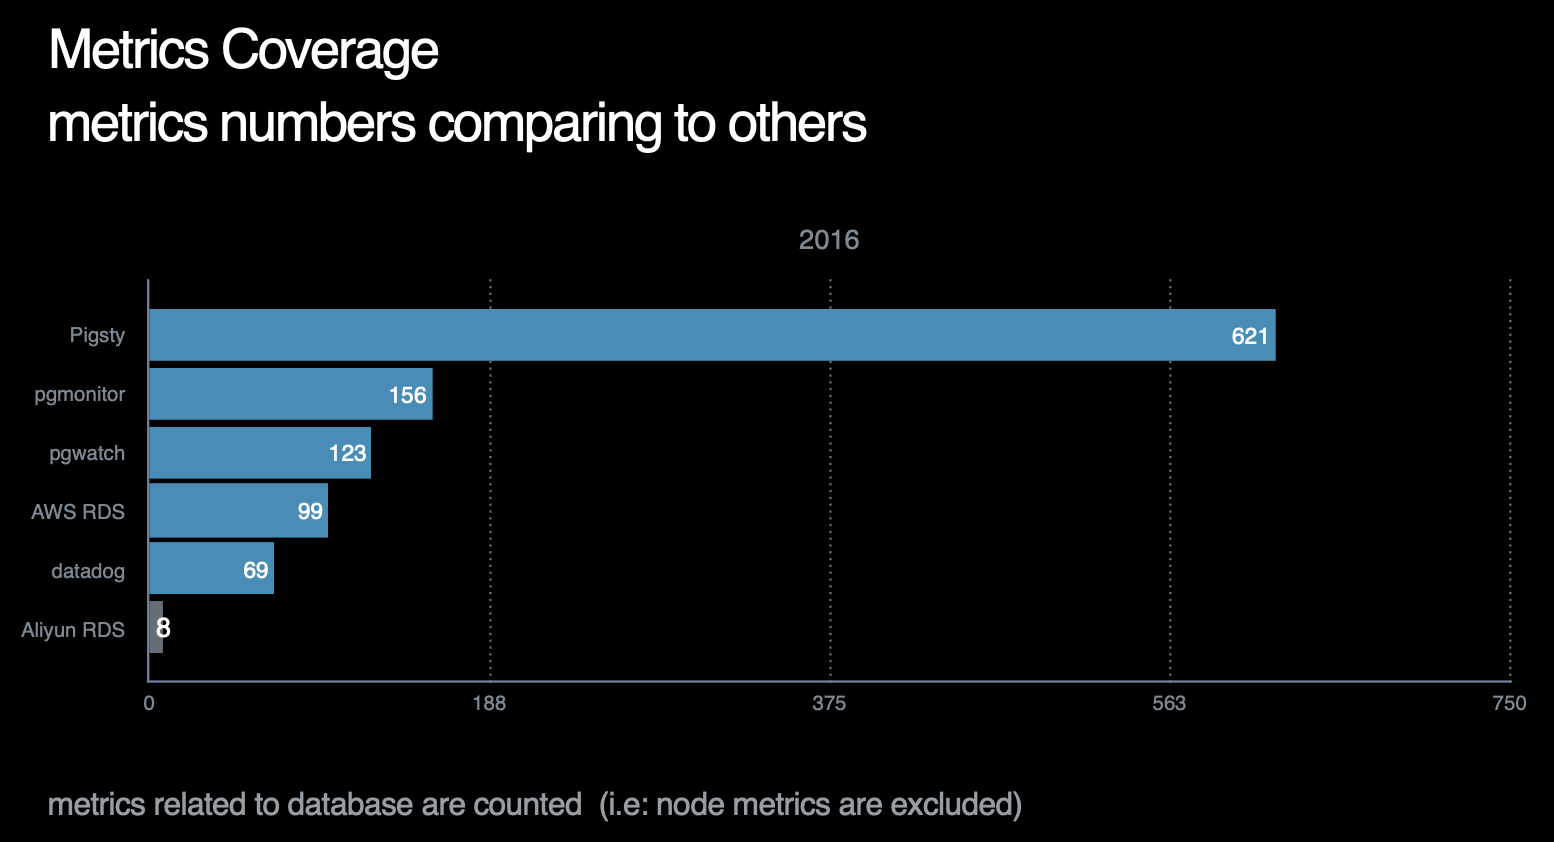
One might ask, although the metrics look impressive with a lot of metrics, what is the practical significance of this? It is true that for fault alerting only a few key metrics are needed. But adequate metrics coverage can further improve our insight and control over the database, and that can’t be too high, more is better.
Competitor
PGWatch
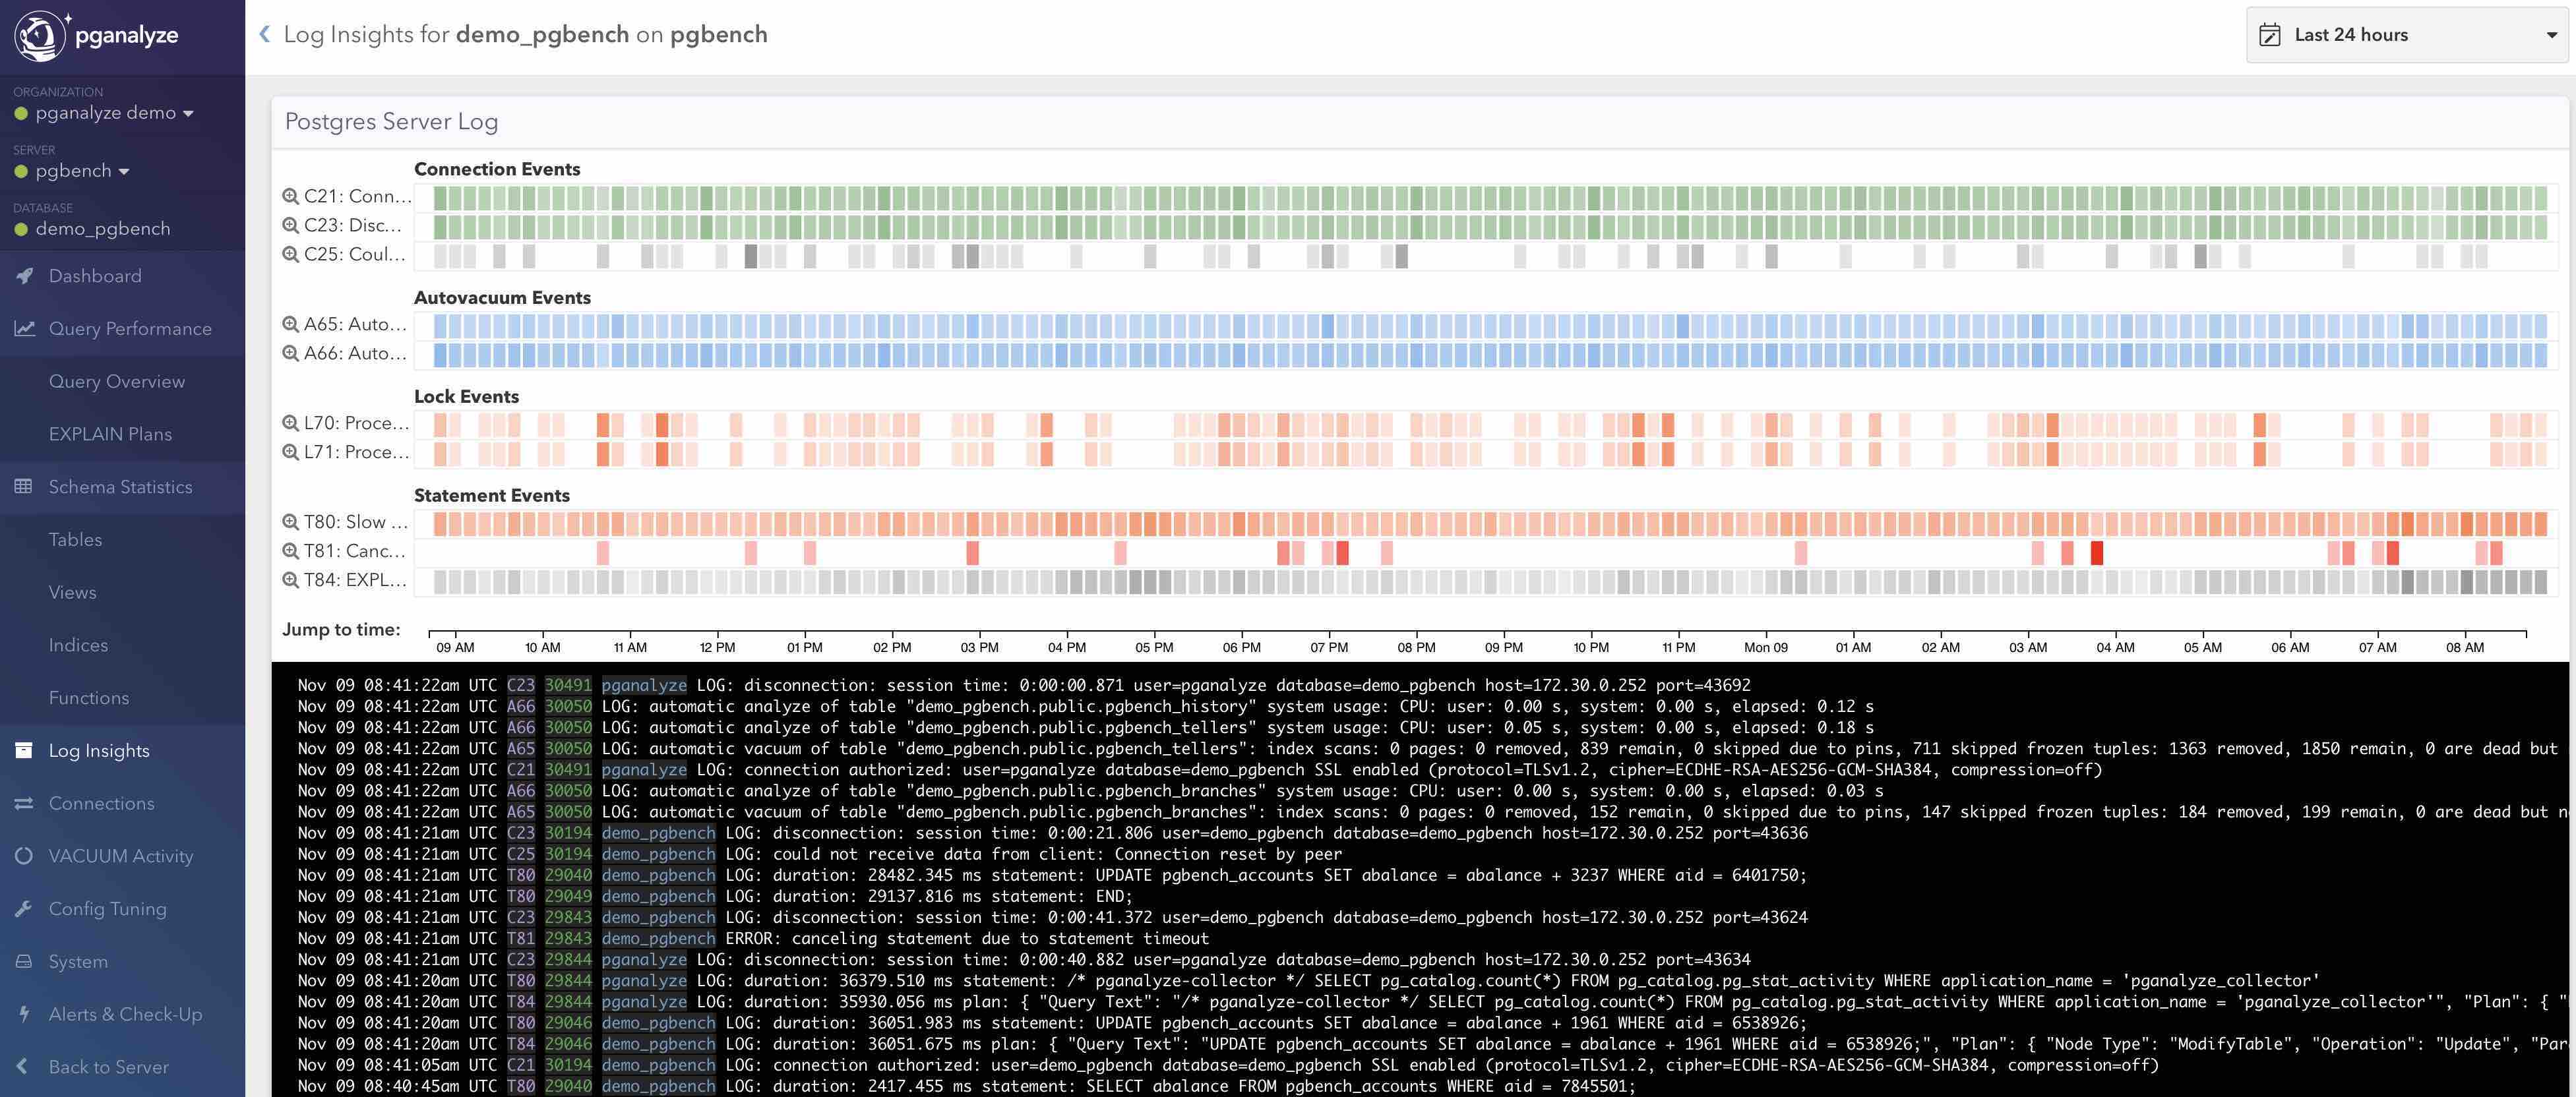
PG Analyze
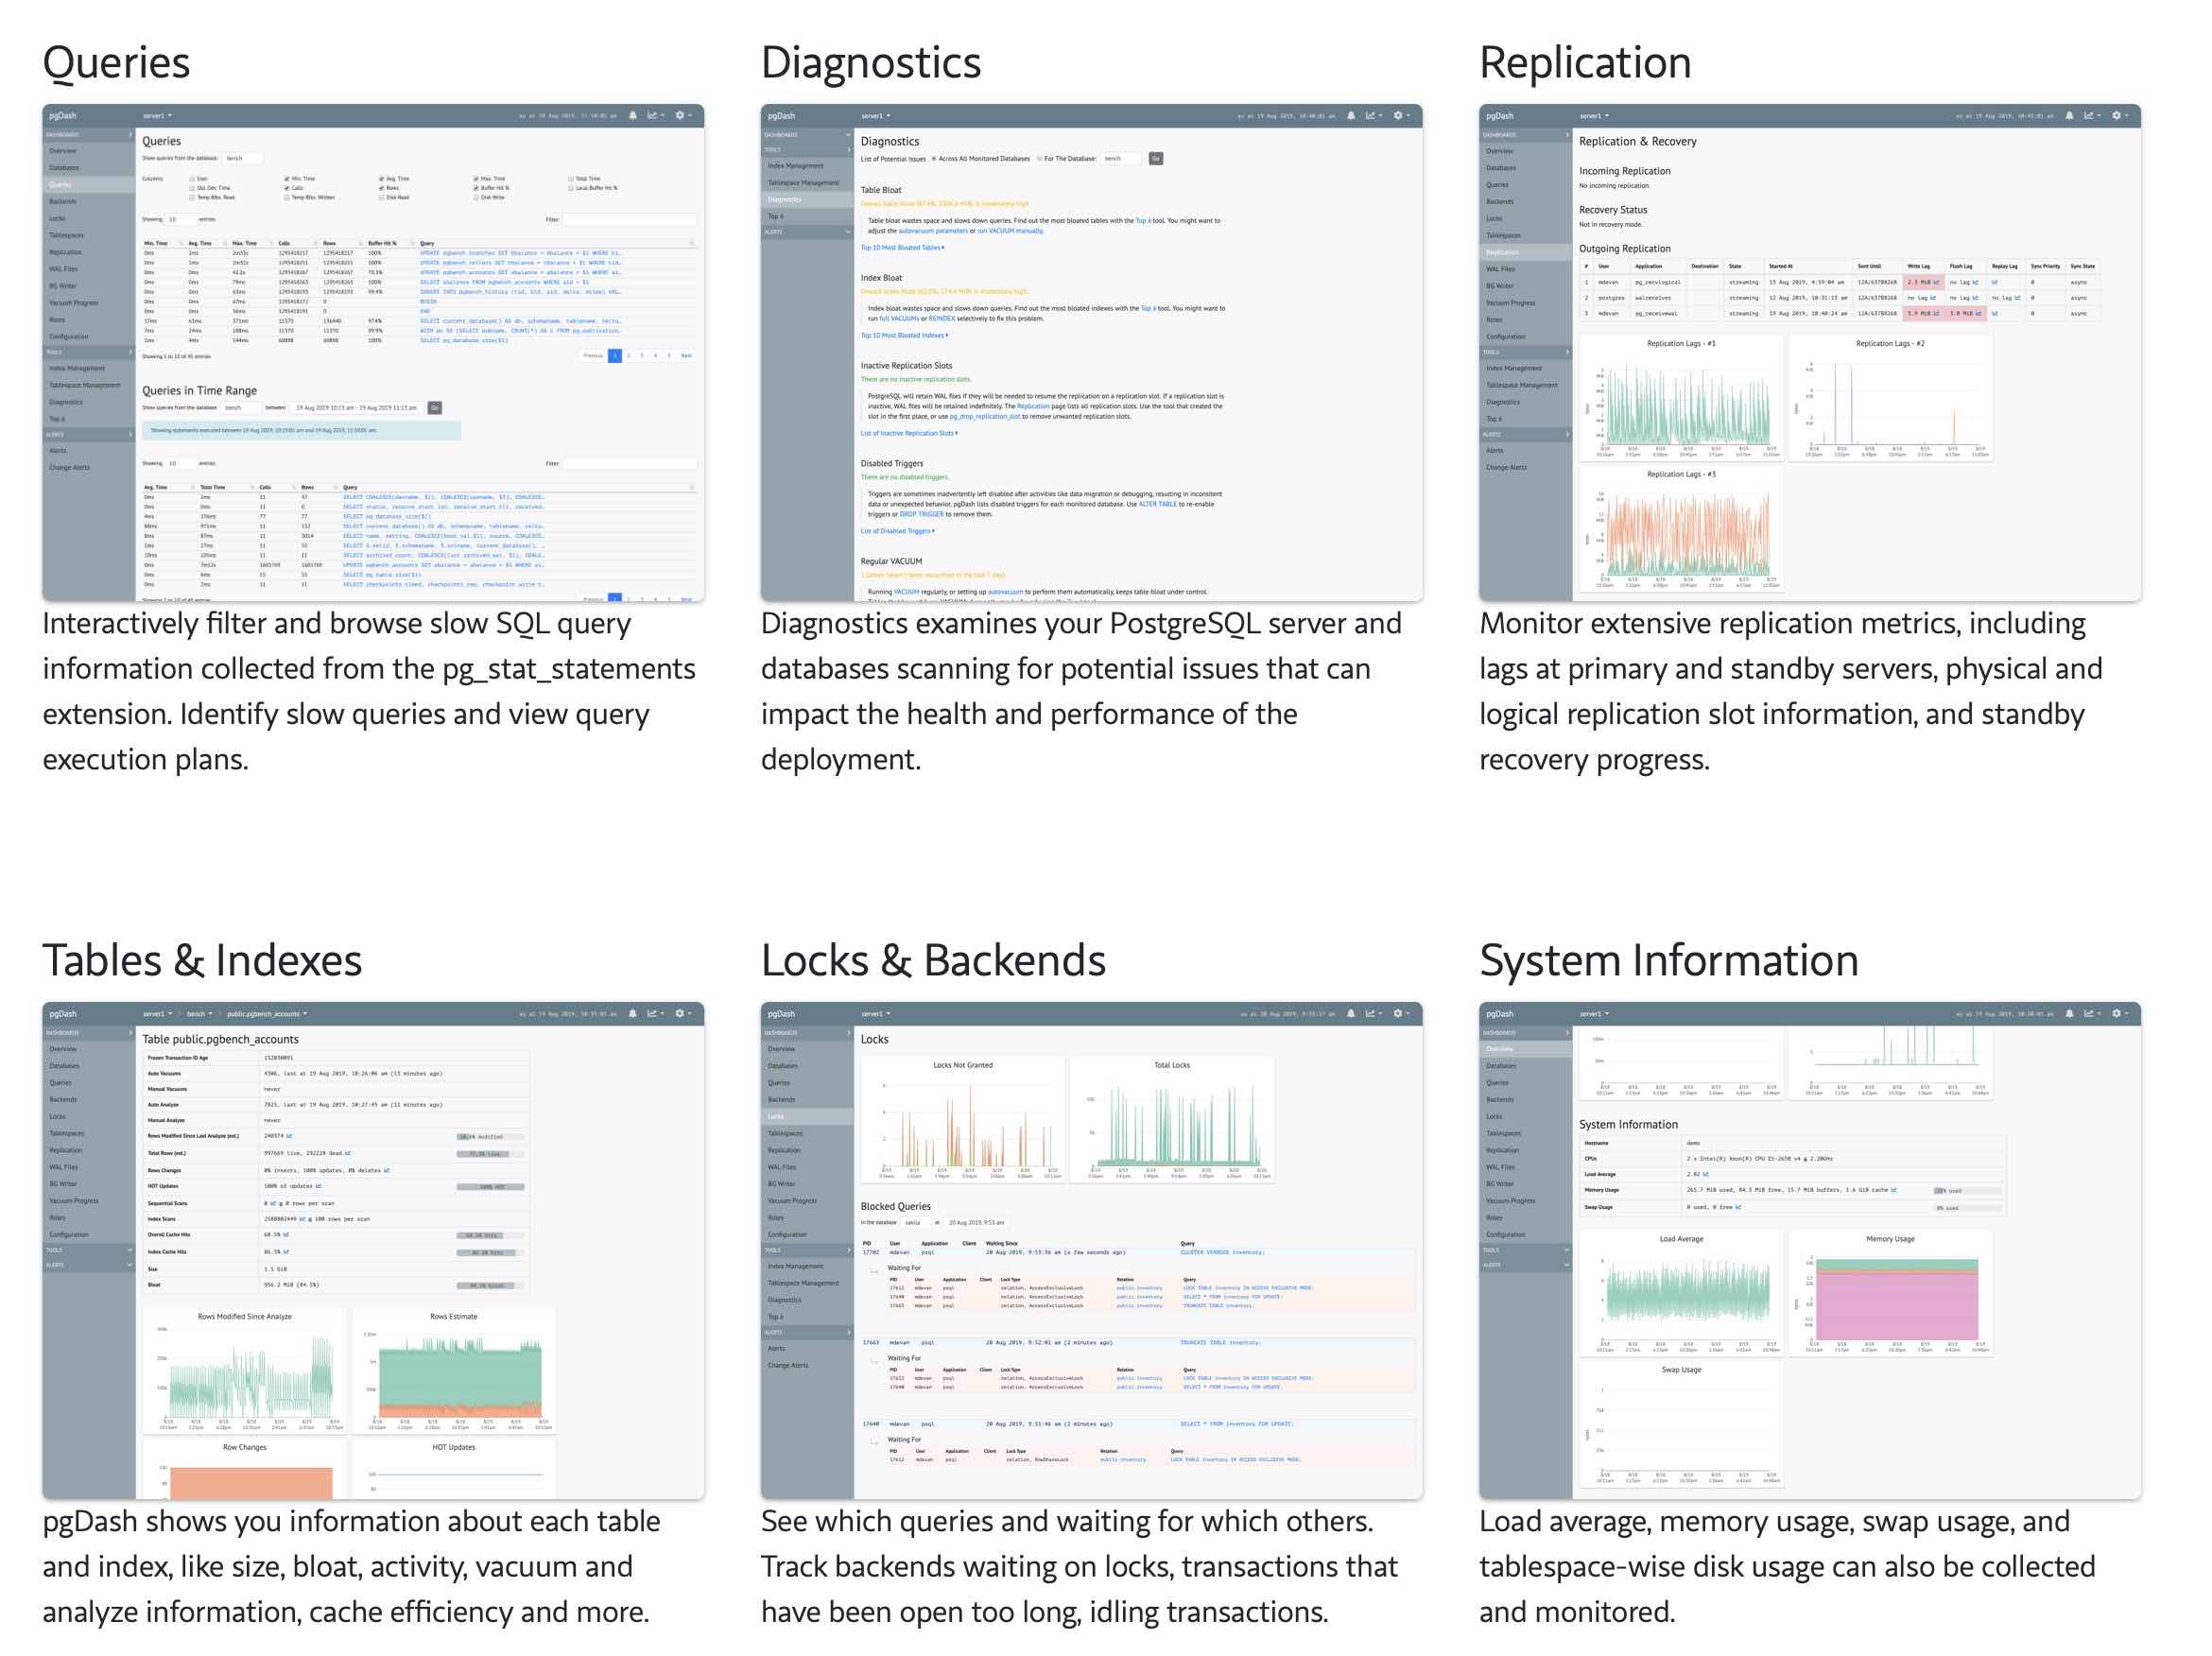
PGDash
PGMonitor
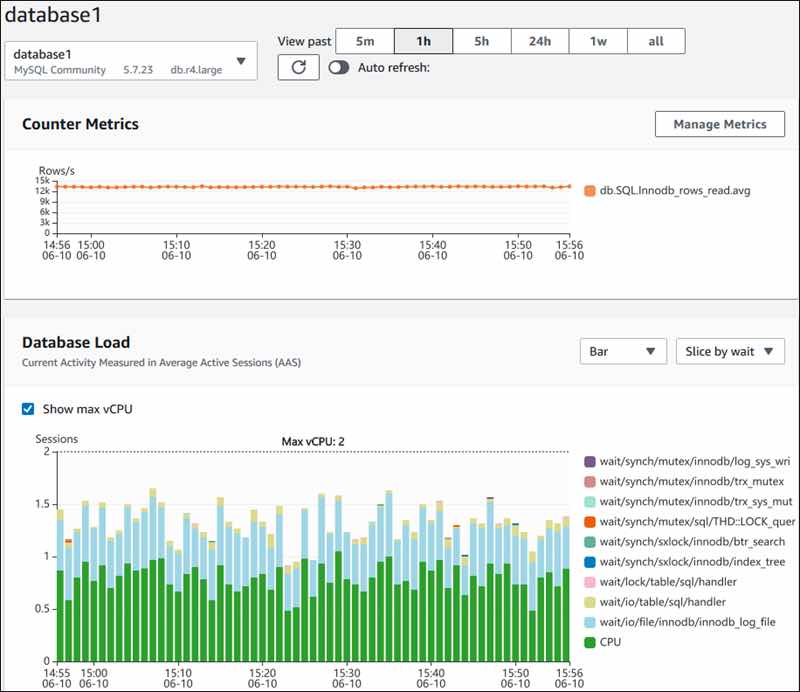
AWS RDS
Azure RDS
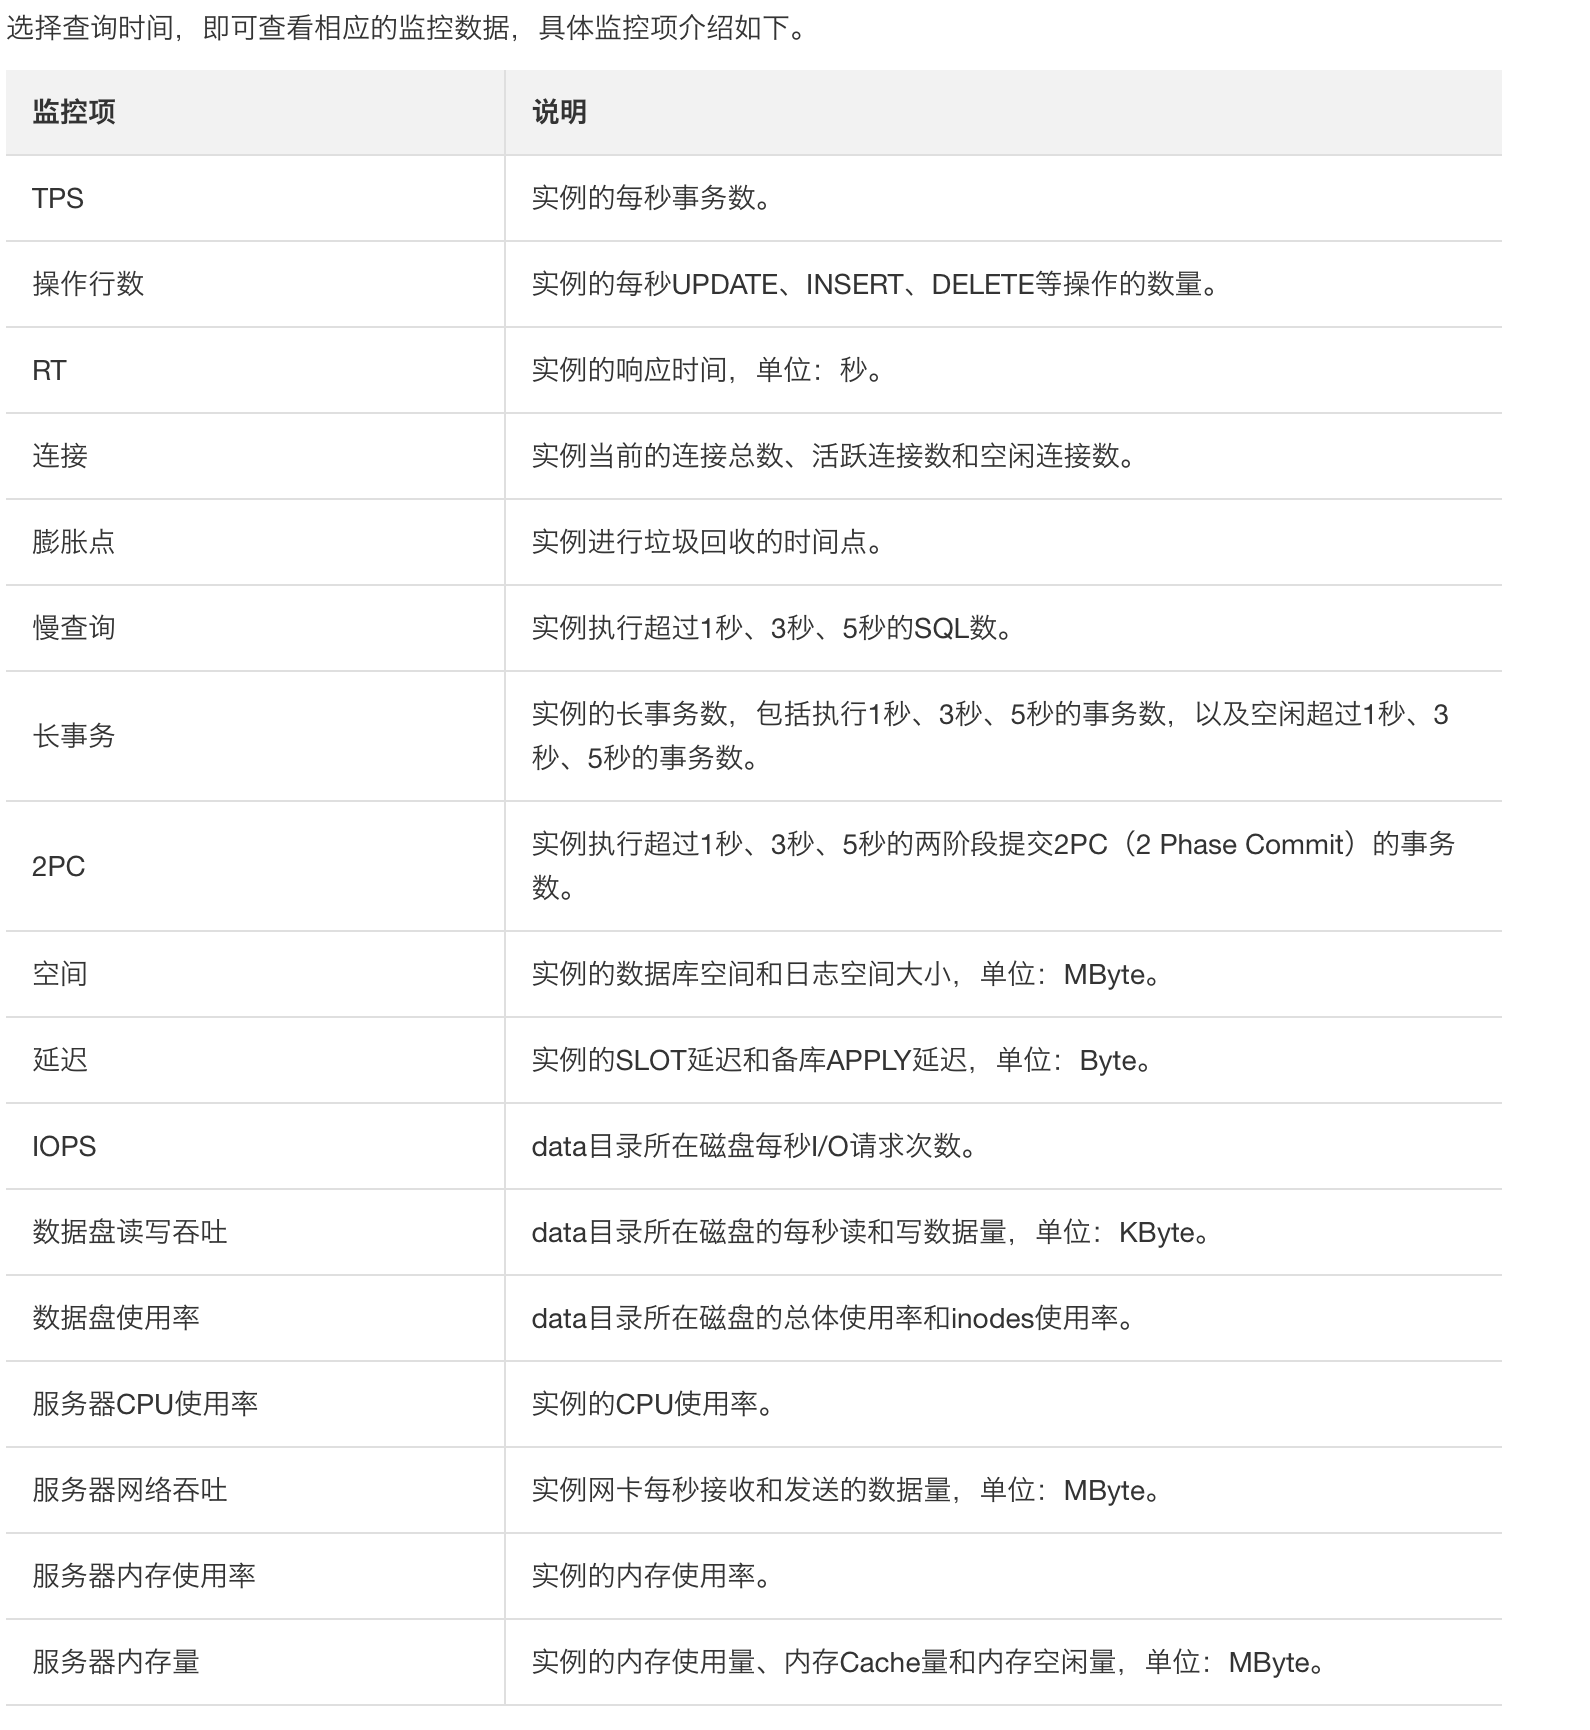
Aliyun RDS